

Although air travel markets have undergone unprecedented disruption in 2020, one day we will return to a market where some airports are effectively at capacity while others are working hard to win new air services. Meanwhile, airlines, as ever, will be trying to understand what the best route network is and where they can best deploy their aircraft.
Many of the questions being asked can be answered by the insights available from four approaches to the analysis of air passenger data.
Demand analysis uses the trends in passenger traffic over time to build a picture of which destinations are gaining in popularity and which are waning.
Unserved analysis can show where passenger interest is building and in the face of insufficient direct airline capacity passengers are finding indirect means to travel - a sure sign that there is potential for new air services.
Gap analysis shows where an individual airport has a weakness in the route network provided by scheduled airlines, especially when compared to neighbouring airports, and therefore points to an opportunity for a new air service or route.
Spill analysis identifies routes where load factors are consistently high, a sign that some passengers wanting to book are being turned away.
The Value of Trend Data
Air passenger traffic patterns are always changing but, in general, we have seen markets grow steadily for many years. Of course, there are always ‘shocks’ which disrupt growth – natural disasters such as earthquakes or volcanic eruptions, economic recessions and financial ‘crashes’, and other events which act to deter people from travelling such as epidemics. The COVID-19 pandemic is the latest shock, albeit very much larger than any other event we have seen in terms of the impact on aviation.
Over time and as disposable incomes rise we observe that people travel more. Sometimes countries that were more restrictive in terms of outbound or inbound travel also become more open due to changing national sentiment and policy. An example is China which has actively been encouraging citizens to venture abroad in recent years. As the Chinese have become more affluent so too have the valued leisure time and travel to leisure destinations. Inevitably, the bulk of a rise in Chinese outbound travel has been within the region, and no more so than in travel to Thailand.
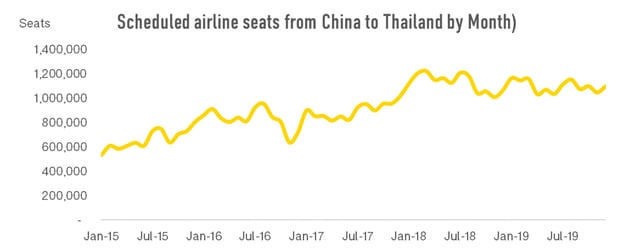 Between 2015 and 2018, OAG data concerning scheduled airline capacity (seats) shows a steady increase in airline capacity from China to Thailand, but since 2018 this has levelled off. The number of unique routes flown between the two countries peaked in 2018 at 1,830, up from 1,031 in 2015. Anyone doing demand analysis using this data in 2017 would have been able to see this increase and, indeed, airlines added routes as they could see demand rising. However, in 2019 as Thailand became more expensive and the Chinese economy faltered, Chinese visitor numbers dipped and airline capacity followed suit. Understanding the factors that drive demand up or down, and using that in combination with quality data on trends in airline capacity and passenger numbers enables analysis to see into the future.
Unserved Air Service Opportunities
A good starting point in identifying new markets which might be the best opportunity for an air service is to look for the largest indirect flows of passengers. That is, where are people flying that they cannot fly to non-stop so they have to connect between two or more flights, or where are there large volumes of indirect passengers even where there are non-stop flights? Are these markets which could do with additional capacity? Of course, passengers may opt for connecting flights when there is a good price on offer and this applies especially for long haul trips. Travellers between Europe and South East Asia may well be able to travel on a non-stop flight but find the lure of attractive fares via Middle East hub airports a strong draw.
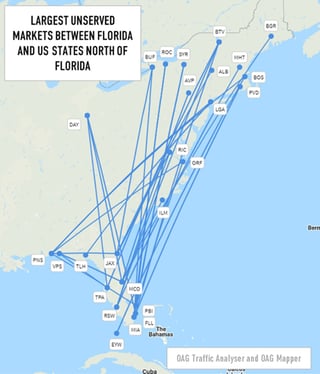 Obviously new airlines need to identify suitable routes for their first operations and sometimes unserved analysis is a good starting point. In the USA, a new airline is being launched under the name Breeze Airways and it plans to have a focus on Florida. There may be as many as 75 million passengers travelling within the US in a normal year who take a connecting flight but, using data from OAG Traffic Analyzer for a typical winter month, it’s possible to see that there were only around 100 unserved domestic market pairs which averaged over 100 one-way passengers each day although direct services on these routes would likely stimulate demand. Looking at the largest unserved markets between Florida and States to the north of Florida will inevitably be a starting point for new route consideration at Breeze Airways.
Airline Network Analysis
Airline route networks typically get more extensive over time as successful airlines grow and expand their networks. As a result, there are opportunities to approach airlines to operate to the next largest market currently not served. This type of gap analysis is particularly useful for secondary airports.
Germany has 20 airports with scheduled services to Austria while Austria has 6 airports with scheduled services to Germany. In total, there are a potential 120 airport-pairs which could be operated but of course, only a fraction of these have direct air services (shown in green). In November 2019, 30 had direct air services.
O&D Traffic between Airports in Germany and Austria, and markets with direct air services (November 2019)
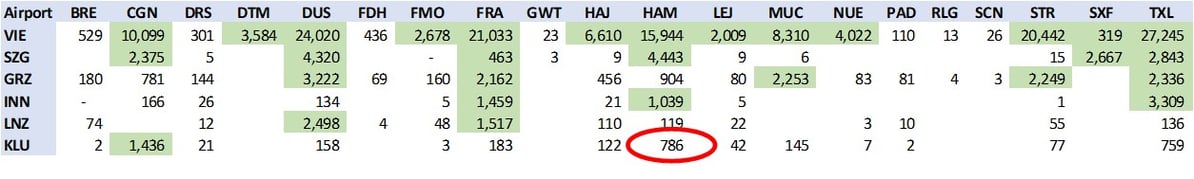
The largest O&D market without direct air services, as shown in the table, is Hamburg (HAM) to Klagenfurt (KLU), a potential ski destination for inbound tourists from Germany. For an airport such as Klagenfurt, Hamburg would likely be top of the target list of new routes to Germany based on this sort of analysis.
In another example, a look at all the European airports served from each of the London airports, London Heathrow, London Gatwick, London Stansted and London Luton, shows that for Luton Airport, the largest unserved destination which is operated to from each of the other airports is Milan Linate.
Air Capacity Evaluation
Another indicator of opportunity is where flights are consistently operating with high load factors. Obviously airlines want their planes to carry as many passengers as possible on each flight, but the revenue management processes in place mean that almost certainly when a route operates with high load factors such passengers wishing to fly on that day and with that airline are being turned away. At the point they want to book the flight will be considered full.
This is an opportunity for an incumbent airline to add capacity, perhaps adding an additional frequency or operating a slightly larger aircraft. It’s also an opportunity for a new airline to enter the market.
Load factors are calculated as the ratio of passengers carried to available seats. In other words, what proportion of seats have passengers sitting in them. There are plenty of markets around the world where passenger demand is so high that many airlines operate the route, with sometimes up to 9 scheduled carriers vying for a slice of the market. This is the case on routes such as Kuala Lumpur to Singapore, Hong Kong to Incheon, Osaka Kansai to Shanghai Pudong, to name a few. A pattern emerges of load factors rising, new airlines operating and then load factors falling as demand is spread between more airlines.