AIRLINE FREQUENCY AND CAPACITY STATISTICS
AIR TRAVEL DATA FROM THE EXPERTS
Which is the biggest airline in the world? Which country pairs have most capacity this month? How many flights are there per day, worldwide and what are the latest airline statistics? And how many airlines and airports are in operation? Our Airline Frequency and Capacity Statistics answer all these questions and more with key facts and figures about air travel and global capacity, using flight data from OAG's Schedules Analyser; a cutting-edge platform for airline schedule analysis.
Key Points From JANUARY's Airline Frequency and Capacity Data:
- Global airline capacity is expected to reach 493.7 million seats this month, a 2.4% increase on January 2025.
- Mexico - USA remains the largest international country pair, with 4.8 million seats.
- The USA remains the largest domestic market with 81.7 million seats.
- American Airlines remains the world’s largest airline by frequency with 183,343 flights scheduled.
SCHEDULED FLIGHT COUNTER
FLIGHTS IN THE SCHEDULE 29TH DECEMBER 2025 - 8th February 2026
Our flight frequency counter shows the number of (one-way) flights in the schedule from Monday 29th December 2025* to the end of the current week. With 4,165,812 flights in total to the end of this week, the average number of commercial flights per day is 101,605.
*The 'year' runs from Monday 29th December 2025 when week one of the schedule starts.
WEEKLY AIRLINE CAPACITY DATA
HOW MUCH AIRLINE CAPACITY IS SCHEDULED THIS WEEK?
This chart shows the most recent weekly global (domestic + international) , domestic and international airline capacity. The dotted line represents capacity in the airlines' future schedules for the next 11 weeks, helping you monitor changes in worldwide airline capacity.
SIGN UP TO WEEKLY CAPACITY UPDATES
We provide a weekly email update on Global, International & Domestic airline capacity, alongside a summary of our popular blogs with expert travel & aviation industry analysis. Sign up for a weekly digest of the best from OAG.
AIRLINE AND AIRPORT COUNT | JANUARY 2026
hOW MANY AIRLINES ARE THERE IN THE WORLD?
- In January 2026, there are 723 airlines operating worldwide.
- There are currently 3,932 airports in operation.
TOP TWENTY AIRLINES | JANUARY 2026
WHICH IS THE Biggest AIRLINE IN THE WORLD THIS MONTH?
- American Airlines remains the largest airline in the world based on frequency in January 2026, and is expected to operate 183,343 frequencies. That’s 4,814 more than January 2025, the biggest increase in frequency among the Top 20.
- Two airlines are growing by more than 5% year-on-year this month: Turkish Airlines, up 9.9%, and LATAM Airlines Group, up 6.7%.
- Of the airlines in decline, three are reducing capacity by more than 5% year-on-year: China Eastern (-6.9%), Deutsche Lufthansa (-8.6%) and Azul Airlines (-12.2%).
TOP TWENTY INTERNATIONAL AIRLINES (BY ASKS) | JANUARY 2026
Count Down Last Month's Most Punctual Airlines
DOMESTIC MARKETS | JANUARY 2026
WHERE IS MOST DOMESTIC CAPACITY THIS MONTH?
- The USA remains the largest domestic market in January 2026 with 81.7 million seats, putting it 11.3 million seats ahead of China, the second largest domestic market with 70.3 million seats.
- China's domestic market is expected to decline by 2m seats (-2.8%) this month compared to January 2025 as a result of Chinese New Year moving from the 29th January last year to the 17th February this year, which moves the peak domestic demand for travel into February.
- The fastest‑growing domestic market year-on-year is Mexico, with capacity up 6.8%, closely followed by Turkiye with 6.3% growth.
- Two other Top 10 domestic markets are also down year-on-year, with Japan declining by 2.7% and Indonesia by 0.1%.
TOP TWENTY COUNTRY PAIRS FOR TRAVEL | JANUARY 2026
WHICH TWO COUNTRIES VISIT EACH OTHER MOST?
- Mexico–USA remains the largest international country pair, with 4.8 million seats scheduled this month. That’s 1.7 million more seats than the second-largest market, Japan–Republic of Korea, which has 3.1 million seats.
- Notably, Japan–Republic of Korea also has the fastest growth rate among the Top 20 country pairs, up 19% compared to January 2025.
- The country pair in the Top 20 with the steepest decline is China–Japan, with capacity down 44% year-on-year, representing 1 million fewer seats in the market. This reduction is driven by China advising its citizens to avoid travel to Japan.
AIRLINE CAPACITY BY REGION | JANUARY 2026
WHICH WORLD REGION HAS MOST FLIGHT CAPACITY?
- This month, global airline capacity is expected to reach 493.7 million seats, a 2.4% increase on January 2025, adding 11.4 million more seats year-on-year.
- The regions adding the most seats year-on-year are Western Europe, up 2.4 million seats, and the Middle East, up 2.0 million seats.
- Southern Africa is expected to see the fastest growth of all IATA regions, with capacity up 11.6% on last year, followed by North Africa at 9.9% year-on-year.
- Meanwhile, of the 17 IATA regions, only the Caribbean and North East Asia are seeing capacity decline, with reductions of 0.6% and 1.3% respectively.
- In North East Asia, capacity has been impacted by a reduction of 2 million domestic seats in China, driven by Chinese New Year shifting from January last year to February this year.
FAQs ABOUT AIRLINE FREQUENCY AND CAPACITY STATS
Where are the Frequency and Capacity statistics sourced from?
All data is sourced from OAG Schedules and is for the current month and previous months stated per chart. This global airline industry data is unadjusted for the leap year effect.
How are the frequency and capacity categories on this page defined?
- The scheduled flight counter shows the number of flights in the schedule from the first day of the year up until the end of the current week.
- Weekly airline capacity shows total global (international + domestic) capacity, international capacity and domestic capacity, measured in seats. It is plotted weekly with a forward view of filed scheduled capacity for the 11 weeks ahead, showing the overall 3 months forward-looking position.
- Top 20 Airlines are the 20 largest global airlines by flights based on the current month.
- Top 20 Country Pairs are those international country pairs with most seat capacity based on the current month.
- Domestic Markets are the 10 largest markets by seats.
- Seats by Region is seat capacity for the current month to, from and within each global sub region.
What is airline frequency and why does it matter?
Airline frequency is the number of flights scheduled on a route over a set period. It plays a key role in meeting passenger demand and improving travel convenience. OAG’s air travel statistics show how frequency patterns shift with market trends.
What is airline capacity?
Airline capacity is the number of seats an airline makes available for sale. They will adjust this over time based on demand and trends in the aviation industry.
How does airline capacity differ from passenger numbers?
The exact number of passengers flying will differ from the number of seats available, though we can assume an average load factor (how many seats are filled) of around 83%, although this will be higher for Low Cost Carriers who tend to operate with an average load factor of 90%. Capacity data and passenger numbers will tend to follow the same trend.
What factors influence frequency and capacity planning?
Airlines consider global aviation growth, market demand, route distance, airport slot restrictions, and more to decide how often aircraft should operate, and what size of aircraft to operate on routes.
How do seasonal trends impact airline frequency and capacity?
Seasonal demand surges, such as holidays, or major events can cause spikes in planned airline capacity, while in off-peak periods airlines may reduce both capacity and frequency.
MORE RESOURCES FROM OAG

Busiest Routes
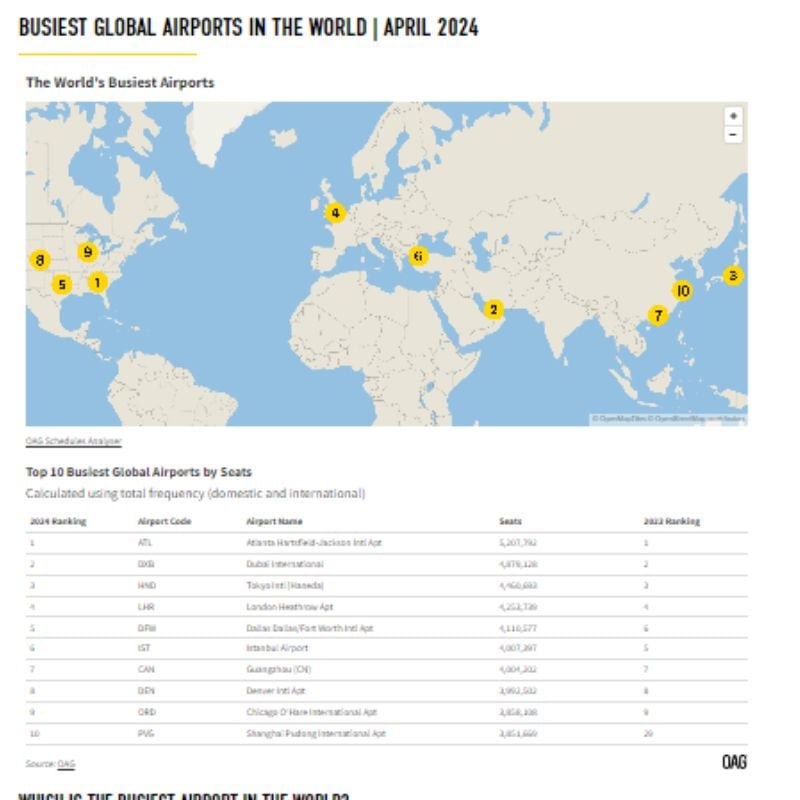
Data and analysis on the busiest global, international and regional airports, updated monthly.
View Now

Aviation Market Analysis
Analysis of the latest data and developments in the aviation world.
Read Now
China Aviation market Data
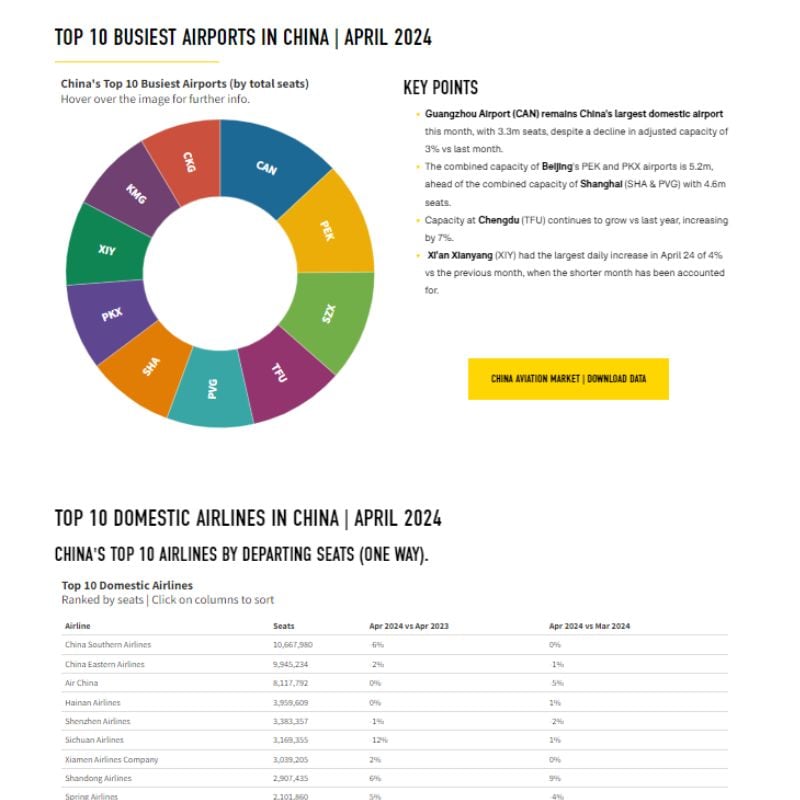
The busiest airports, largest airlines, biggest cities for airline capacity and more
View Data
US Aviation Market Data
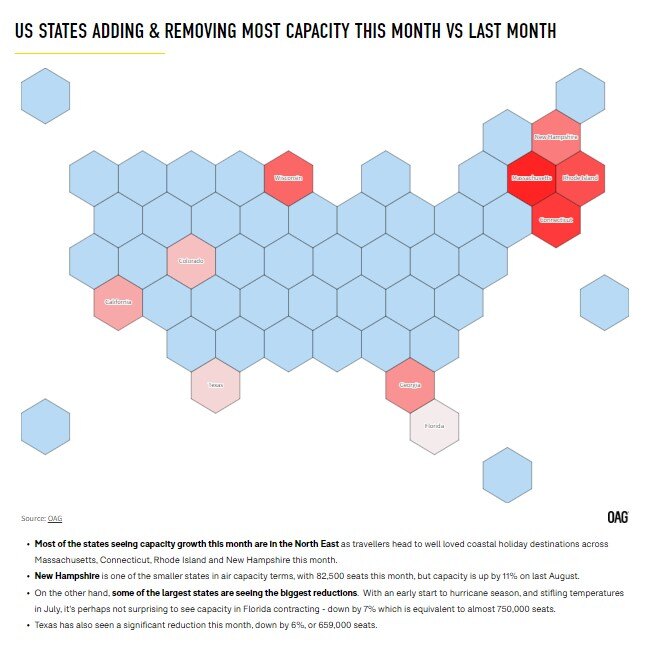
This month's leading airlines, airports, states and more from the US market.
View Data
South East Asian Aviation Market Data
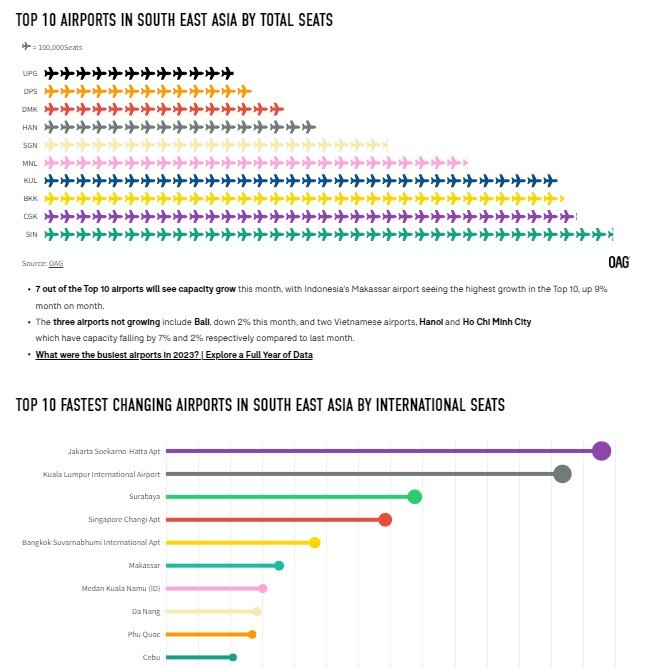
SE Asia's biggest country markets, airports, airlines and more are updated each month.
View Data

