COVID-19 AVIATION INDUSTRY RECOVERY
HOW DID COVID-19 IMPACT THE AVIATION SECTOR?
Since the news first broke of the coronavirus spreading fast around the world in March 2020, we tracked weekly airline capacity and its ups and downs. At the very lowest point in early May 2020, airline capacity fell to less than one third of the level that operated in May 2019.
Since then, the only way has been up, with the Covid-19 travel recovery beginning in earnest in 2022 in some regions. By the close of 2023, many markets across the world were back to 2019 capacity levels, which became the benchmark for a return to normality. With 2023's yearly capacity total just 3.7% below 2019, we're wrapping up reporting on weekly capacity in this format going forward, but will be updating our Airline Frequency & Capacity Statistics page with weekly airline capacity data.
SIGN UP TO WEEKLY CAPACITY UPDATES
We'll continue to provide a weekly update on Global, International & Domestic airline capacity, alongside a summary of our popular blogs with expert travel & aviation industry analysis. Sign up for a weekly digest of the best from OAG.
GLOBAL TOTAL AIRLINE SEATS DURING CORONAVIRUS (DOMESTIC + INTERNATIONAL)
The air travel data is plotted by week from the beginning of 2019 to w/c 25th December 2023.
The data is shown weekly, for 5 years, with 2019 as a baseline for global capacity. Each week this chart was updated with the latest information to track the recovery of the aviation industry during the pandemic. The chart shows airline capacity decreasing dramatically in Spring 2020, reaching a low of 30,577,575 seats in week 19. Capacity then increased each year from March 2020 onwards, with the teal line that represents 2023 starting to meet the yellow line of 2019. This indicates that air travel and airlines have largely recovered from the coronavirus.
AIRLINE SEATS DURING THE PANDEMIC (DOMESTIC + INTERNATIONAL SEPARATE)
These charts show the different patterns in recovery for the domestic and international markets. The data provided includes the number of scheduled airline seats for domestic and international flights by week for 5 years, again with 2019 as the baseline for capacity. As with the global chart above, each week this chart was updated with the latest capacity position up until the last week of 2023 (w/c 25th December).
Domestic flights saw a rapid capacity recovery from the lowest point in May 2020. Capacity plateaued in late 2020 before recovering each year. By the end of 2023, air travel had returned to pre-coronavirus levels.
International flights began to feel the impact in March 2020, with capacity quickly falling over the following months to around 12% of January levels. Recovery remained weak until mid-2021, but like domestic travel, capacity grew steadily year by year, eventually returning to pre-pandemic levels in 2023.
DOMESTIC AIRLINE SEATS IN COVID-19
INTERNATIONAL AIRLINE SEATS IN COVID-19
FAQS ABOUT CORONAVIRUS AIRLINE RECOVERY
How did Covid affect air travel and airlines?
The COVID-19 pandemic significantly impacted the airline industry through sharp declines in passenger demand due to travel restrictions and border closures. Airlines grounded fleets, reduced staff, and incurred substantial financial losses. Passenger revenues dropped dramatically, while cargo operations became more important for maintaining cash flow. Recovery patterns varied, with domestic markets generally rebounding faster than international routes. The crisis also accelerated digital adoption, efficiency measures, and fleet restructuring across the industry.
Has air travel returned to normal after the Coronavirus?
Largely,air travel has returned to capacity levels exceeding the Covid-19 pandemic. However, this varies between regional and country markets. Also note that while capacity returned to 2019 levels in 2023, the industry lost several years of typical growth in the interim.
What are the trends in air travel post Covid-19?
Post-COVID air travel trends include a strong rebound in passenger demand, with domestic travel recovering faster than international. Leisure travel has led the recovery, while business travel remains below pre-pandemic levels. Airlines are prioritizing efficiency through newer, more fuel-efficient aircraft and streamlined operations. Digital adoption—such as touchless services and flexible booking—has accelerated. Capacity has largely returned to 2019 levels, but the industry continues to face supply chain constraints, staffing challenges, and evolving traveler expectations.
Follow our Airline Frequency and Capacity Trends to track air travel trends in future.
MORE RESOURCES FROM OAG
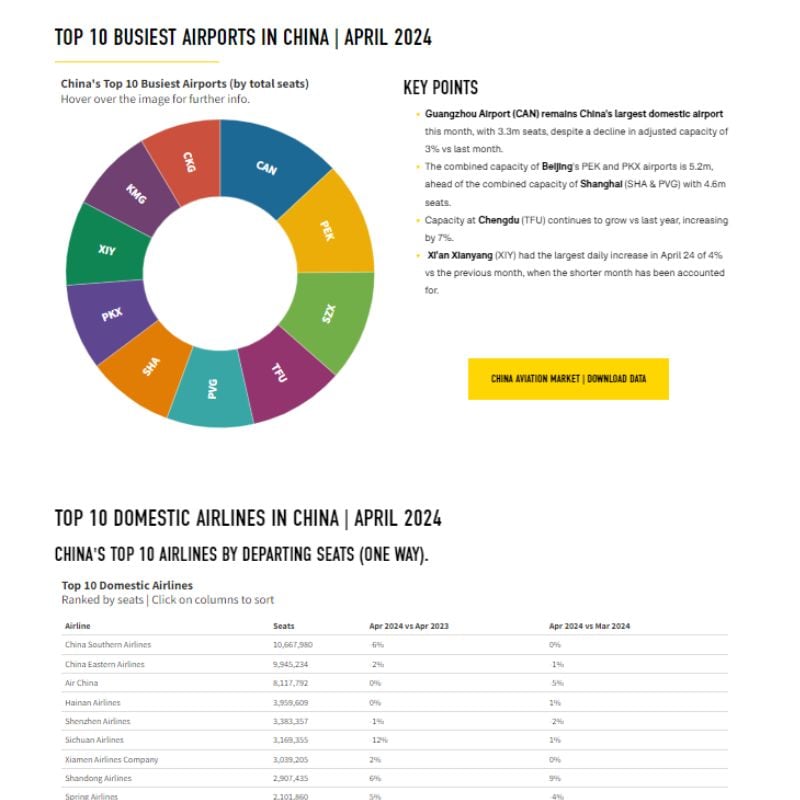
China Aviation market Data
The busiest airports, largest airlines, biggest cities for airline capacity and more
View Data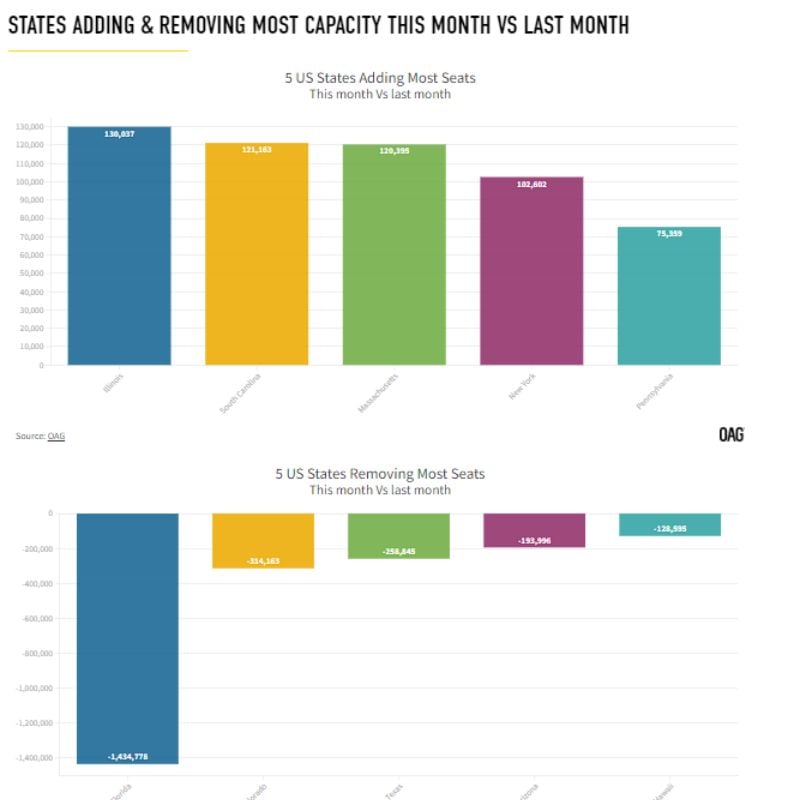
US Aviation Market Data
This month's leading airlines, airports, states and more from the US market.
View Data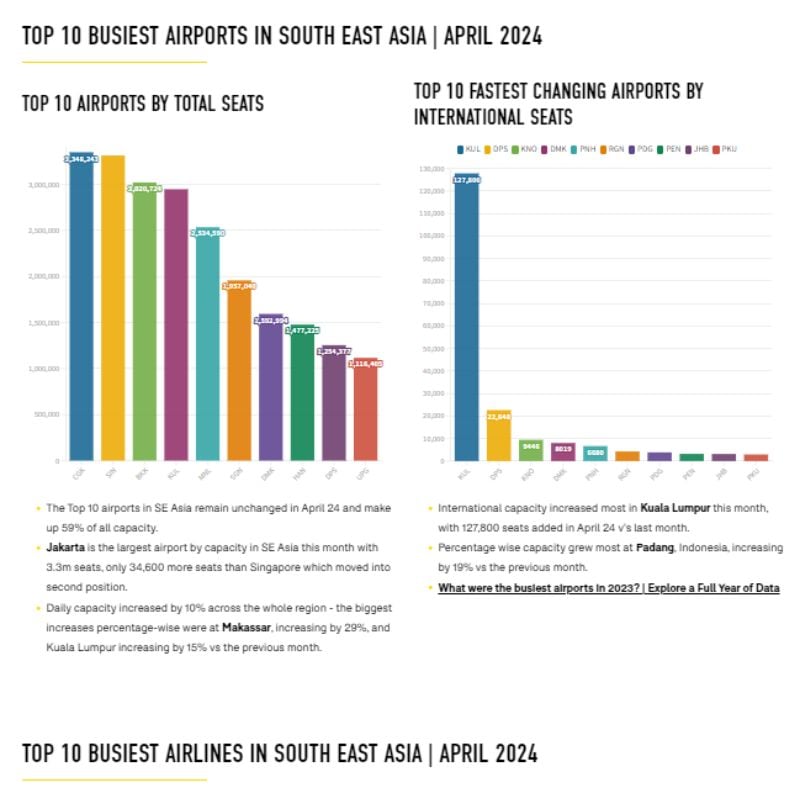
South East Asian Aviation Market Data
SE Asia's biggest country markets, airports, airlines and more are updated each month.
View Data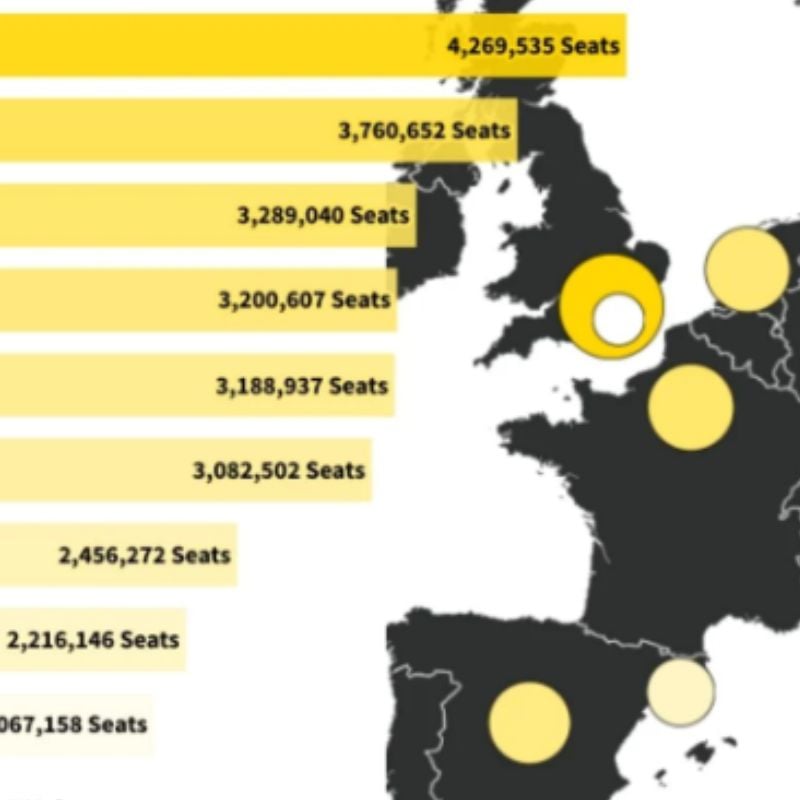


Aviation Market Analysis
Analysis of the latest data and developments in the aviation world.
Read Now


.jpg)


.png)


