

Understanding how passengers flow around the global airline network is vital for airlines, airports, tourism bodies and many more types of organisations. Thankfully, the aviation industry is well set-up to track where aircraft fly via the national and international flight schedules that airlines operate, and also how many passengers use those air services to fly between airports and cities and where they make flight connections when they need to.
While many organisations need this data in order to plan for the short and long term the COVID-19 pandemic has demonstrated that understanding air passenger flows isn’t just something that airlines, airports and tourism bodies rely on. Airline schedules data was invaluable for organisations such as the world’s health organisations and research institutes as they needed to track who might be flying where in the early days of the pandemic, and then understand patterns of air travel between countries in an effort to understand how contact might affect the spread of the virus, and when to impose travel restrictions where they felt them to be necessary. Being able to create an airline network map simply and quickly is helpful in visualising data and traffic flows.
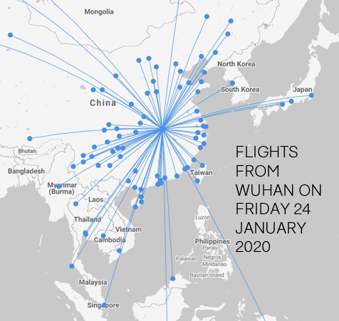
Flights departing from Wuhan on Thursday 24th January 2020
- 35 airlines operated 260 flights with 44,000 seats
- 226 flights to other cities in China
- 34 flights to another 17 countries including Australia, Russia, UK and USA
WHO NEEDS PASSENGER FLOW DATA?
In more normal times, there are many uses for airline passenger flow data.
Tourism destinations need to understand how the availability of direct air services affects how visitors choose their city, resort or hotel over other options. Here are a few examples of how tourism and destination marketing organisations use it.
- Travel companies want to see where the next ‘hot’ destination is so they can create products and experiences which will drive revenues and attract bookings. In recent years cities such as Warsaw, Kiev and Sofia in Eastern Europe have seen more travellers seek them out.
- Governments and Tourism Organisations need to understand the origin of passengers to their country, enabling them to build robust business cases for airlines to create more direct flights with those countries. For fast-growing destinations such as Adelaide, knowing where passengers originate is invaluable.
- Vietnam’s phenomenal tourism growth in recent years has its foundation based not only on relaxing visa requirements but also in a solid understanding its inbound market.
- In the Caribbean where tourism accounts for 75% of the country’s GDP understanding passenger traffic data has given some islands a stronger competitive advantage,
Businesses providing services to departing and arriving passengers, airlines, airports and hospitality such as car rental companies, catering and cleaning providers and fuel distributors, analyse inbound traffic flows to plan resources, win tenders, inform expansion and investment decisions.
For retailers and brand owners, blending consumer data with airport passenger flow data, and knowing which traveller profiles are likely to be connecting between flights at an airport, creates powerful insight. When a retailer can understand demographics, routes, time, origin and destination of the travellers in a single airport they can really optimise the value of their store and capitalise on footfall.
For governments, tracking air travel demand helps reach decisions about infrastructure projects and bilateral air services agreements with other countries and enables forecasts for future demand and use. For a proposed infrastructure project such as the third runway at London Heathrow, understanding future need and what airlines might want to fly has been an important element of the decision.

DATA SOURCES FOR PASSENGER FLOWS
Both airline schedule data and airline passenger data provide valuable insights about how passengers flow through airline networks and via airport networks.
Historical flight data and airline schedules data is granular, providing a high level of detail about the capacity available on aircraft, by year, season, month, week, day, hour and even by flight. With data available going back over 20 years it’s easy to identify trends, and gain valuable insights into where growth of occurring, how networks are evolving and airport flight history.
Moreover, schedule data provides a glimpse into the future. Since airlines file schedules ahead of time, the schedule for months in the future is an indication of what airlines plan to operate, usually in response to what they understand about future demand for air travel.
Air passenger data provides a different sort of detail: Given that passengers onboard an aircraft may be making very different journeys, with different origin airports for their travel by air and different destinations, air passenger traffic data provides the number of passengers travelling between every origin and destination combination, and all the airports in between. Once you combine MIDT data (Marketing Information Data Tapes) sourced from Global Distribution Systems (GDS) bookings data, airport information and other data sources you can view passenger travel patterns that cover the whole market and understand the real world flight plans used by passengers.
AIRPORT CONNECTIVITY
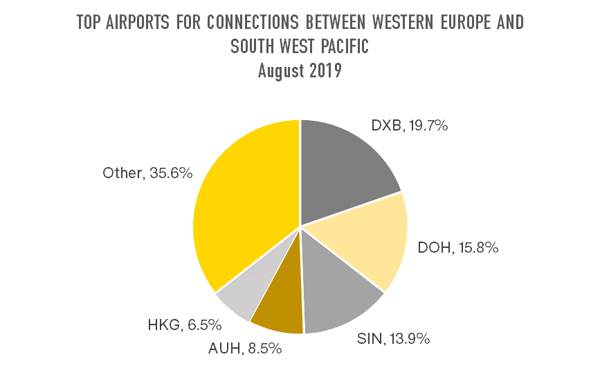
As many airlines seek to operate networks of flights so that they can provide air services to as wide a range of passengers as possible, understanding connectivity is a key aspect of airline network analysis. For instance, on the renowned ‘Kangaroo Route’ between Western Europe and Australia and New Zealand, it’s useful to know that at least 44% of passengers connect via one of the big three Middle East hub airports and, when delving into the data in more detail to look at passengers who connected twice, it is apparent that even more passengers connected via these airports at some point in their journey.
UNDERSTANDING WHO IS SITTING ON THE PLANE
An alternative lens through which to understand air passenger traffic is to see the composition of journey types for passengers taking a common flight. The transatlantic for many airlines is a very lucrative source of revenue and London Heathrow to New York JFK corridor is one of the most lucrative for airlines due to the number of business travellers using it. A month of data from December 2019 shows that of the nearly 100,000 passengers travelling from LHR to JFK, 59% were simply flying between the two airports with no connection at either end of the flight. These were also the most valuable passengers on the plane, averaging a fare of USD906 per passenger, compared to just USD442 for passengers connecting at LHR from another flight.
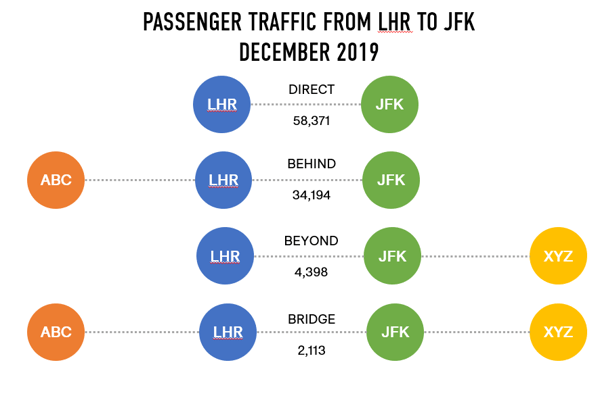
OAG Traffic Analyser – Mix Report
TOOLS FOR MODELLING PASSENGER FLOW
The combination of airline passenger statistics and flight history are a powerful combination that can be used to understand trends and provide insights about how passenger in the real world move through airline networks, where they fly to and from, and the role airports play in those passenger journeys. OAG’s Traffic Analyser , Schedules Analyser and Connections Analyser are powerful tools that allow the user to see, visualise and extract precisely the data about how passengers travel that is required for the analysis they need.