
It has been a very quiet week for global flight capacity with one of the smallest percentage changes in capacity that we have seen in the last year. That would normally be a welcome development, if only we were not languishing at around half of the normal capacity levels. However, for any network planner it may seem that they have taken a well-deserved rest, the truth is that they are probably now beginning to look at what March and April could bring aside from bunnies and Easter eggs.
At the beginning of 2021, yes only eight fun weeks ago, we were expecting capacity of 553.8 million, we ended up with 451.5 million; a 19% reduction in capacity. Putting that in a slightly different way if you had a flight booked in January to travel by the end of this month you had around a one in five chance of the booking being impacted by some form of change. It’s never been tougher to plan an airline network, but it has also never been harder to book a flight with real confidence of it operating; and restoring that confidence will be crucial going forward
Current loaded capacity for March stands at 278.2 million seats compared to the 380.8 million that did operate in March 2020; if March follows the same pattern as February where we saw capacity shakedown by some 8% then we could be looking at capacity of around 256 million seats for the month; which would be around one-third lower than last year’s level.
.Chart 1 – Scheduled Airline Capacity by Month
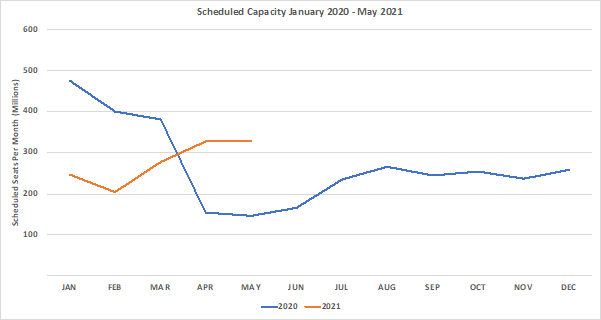
Source: OAG
Nine of the seventeen geographic regions continue to operate at less than 50% of their pre Covid-19 levels with Western Europe the worst performing region on the planet with more than three quarters of capacity lost. Six regions reported week on week growth with Lower South America leading the way with a 5.9% increase, or some 108,000 seats although in absolute terms North East Asia’s additional 650,000 seats is the largest region for growth.
Table 1– Scheduled Airline Capacity by Region
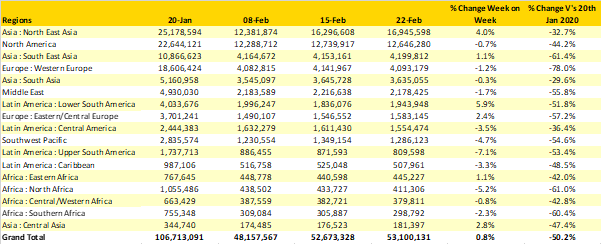
Source: OAG
Another 606,000 thousand seats have been added back in China of which 99% are operated on domestic services but as discussed on last week’s OAG webinar long term such a reliance on domestic capacity will not provide the necessary returns for the airlines. Pre-Covid some 13% of Chinese capacity was operated on international sectors and whilst that may not be as high as some markets at over 2.1 million seats it is a long way from the current 123,000 a week!
Brazil has reported the fastest growth this week amongst the twenty largest country markets with nine percent growth taking capacity just above 1.5 million seats a week. All of that additional capacity is in the domestic market where over 130,000 extra seats have been added; international capacity continues to be cut with a 12% fall back to just 55,500 seats as travel restrictions impact the market.
Table 2- Scheduled Capacity, Top 20 Country Markets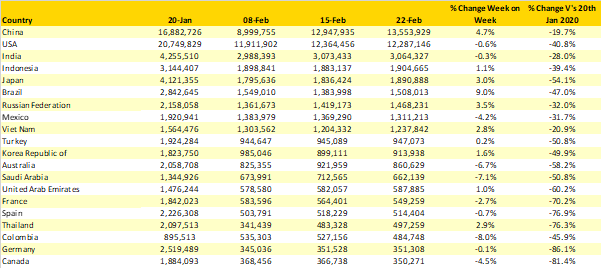
Source: OAG
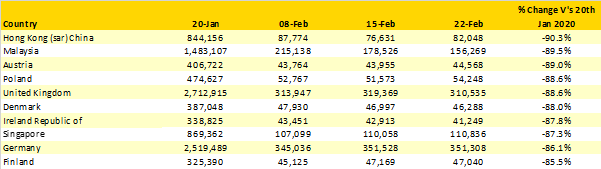
Whilst much of the weekly update reports on the biggest markets and airlines it is also worth occasionally reflecting on how damaging Covid-19 has been on selected markets that once formed part of the worlds top twenty. As you can see below, there are once major aviation markets that continue to be very badly affected, all of those listed operating at less than 15% of their normal capacity. “Leading” the losers is Hong Kong that in a typical “normal” week would see some 150,000 seats a week to China; just the return of that capacity alone would make a tremendous difference to capacity at Hong Kong.
Perhaps surprisingly Austria also appears in third place in the chart of despair. Surely against such a backdrop the idea of a minimum fare level of 40 euro’s which continues to be discussed will be seen for the madness that it is; unless of course politics and protectionism are part of a wider strategy; who knows!
Table 3- Scheduled Capacity Top 20 Major Country Markets Capacity Declines
Source: OAG
In a strategic “tease” from American Airlines, the carrier dropped capacity by a few thousand seats week on week but with Delta Air Lines only adding 375 seats this week and therefore failing to reclaim the title of the world’s largest airline. Congratulations American Airlines: a sneak peek at next week’s capacity suggests that American will widen their lead but as we know things can change very quickly.
Alaska Airlines enter the top ten again this week despite making no changes to their capacity by seeing those carriers above them reduce capacity; in this case LATAM Airlines who have dropped 3% of last week’s capacity with Brazil, Colombia and Chile all seeing capacity reductions.
.Table 4- Scheduled Capacity Top 10 Airlines

Forward looking capacity reflects the airlines hopes for demand to pick up as vaccination roll outs continue and consumer confidence hopefully rebuilds. Many US carriers have significant increases in capacity planned for the next three weeks, perhaps in part because of the traditional spring break market and then the roll into the Easter holiday period. It will be interesting to see if that capacity holds especially since it is generally domestic capacity and will therefore be more impacted by consumer confidence than government lockdowns.
Maybe the tide is about to turn towards some really solid sustainable growth but as always, only time will tell.
Stay safe everyone.