
It was only ever likely to be for a week, but China has snatched back the title of the world’s largest aviation market from the United States with a stellar 32% increase in capacity week on week and a more modest 4% growth in the last two weeks. Total weekly capacity is now back at 52.6 million although that only takes us to just above half the capacity levels reported before Covid-19.
This week’s OAG Webinars will focus on the China market so they may be worth a listen.
In the last week, an additional 39.2 million scheduled seats were removed from the database for the next three months, through to the end of April with five million removed for the last two weeks of February. Some airlines are now making their final schedule changes with less than two weeks’ notice whilst some airlines are just rolling forward their historic schedules and making adjustments at around six weeks before the date of travel. For airlines, second guessing new lockdowns and quarantines has become a lottery that continually rolls over but never pays out.
That said vaccine roll outs are clearly injecting (sorry, had to do that one) into the market; after all what else would a near 400 million planned level of capacity in May indicate; other than very few airlines have even looked beyond March or have any idea what to do! We should expect a lot more capacity to be removed in coming weeks despite the good news we are seeing in some markets.
.Chart 1 – Scheduled Airline Capacity by Month
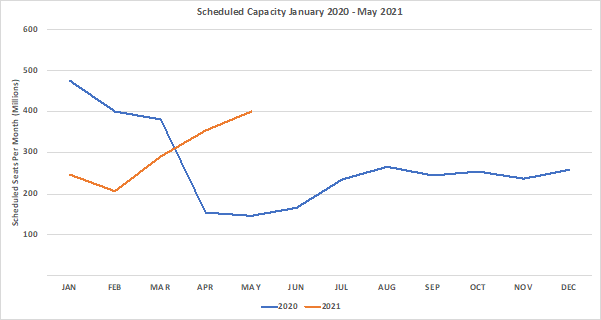
Source: OAG
North East Asia returns to pole position amongst the global regional markets with nearly 16.3 million seats this week; an increase of some 3.9 million all of which is built around the recovery in China. The bounce back is clearly very welcome, but the region remains at 35% below pre Covid-19 levels with airlines increasingly warning of worse than expected losses for the first quarter of 2021; did they really expect anything else?
The regional markets of Latin America are beginning to report a regular decline in capacity, Lower South America is minus 9% on the previous week and Upper South America is down by 13% over the last two weeks. The pattern of capacity changes in the first round of Covid-19 last year impacted South America around six weeks later than Asia and Western Europe; we may just be beginning to see the pattern replicated in capacity cuts for 2021; let’s hope not.
The Southwest Pacific region has been growing with regular consistency over the last few weeks with a further 9.6% growth this week; total capacity has grown by 29% since the last week of January. The overnight news of the travel bubble bursting between Australia and New Zealand is no surprise; bubbles are meant to burst, but with only 11,000 seats a week it hardly registers in terms of overall impact although it’s a great headline for the newspapers.
Table 1– Scheduled Airline Capacity by Region
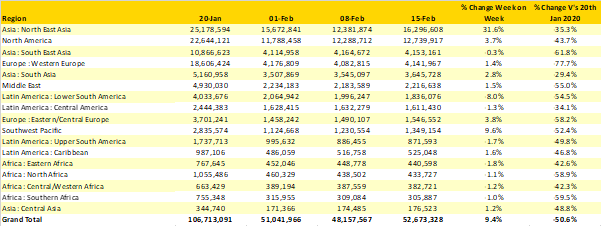
Source: OAG
With China back as the largest country market in the world there isn’t really much other movement this week across the top twenty countries and we’ve therefore decided to take a look at some other data points.
This week we are looking at the airports with the largest domestic and international capacity and the extent of change that has occurred. If anyone really wants to know where each country ranks then just ask, the United Kingdom is now in second position in the Championship along with Brentford which probably says it all really!
The table below shows the top twenty airports this week in terms of international capacity. In total, international capacity increased by just over 1% week on week and is now standing at 9.5 million seats compared to over 41.6 million in January 2020: just over one fifth of its normal levels. Not surprisingly major hub airports with a heavy reliance on international-to-international connectivity have been the most damaged; locations such Singapore and London Heathrow “top” the table with less than 20% of their normal international capacity running this week.
And finally, for those looking to escape Storm Darcy in Europe and some very cold temperatures, forget it. Capacity in the UK is at just 11% of last year’s level and Germany at 13%, so finding a flight to anywhere would be very difficult.
Table 2- Scheduled Capacity, Top 20 Airports Departing International Capacity
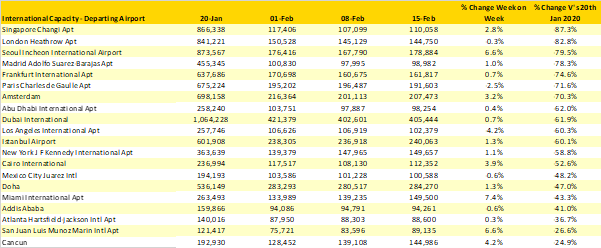
Source: OAG
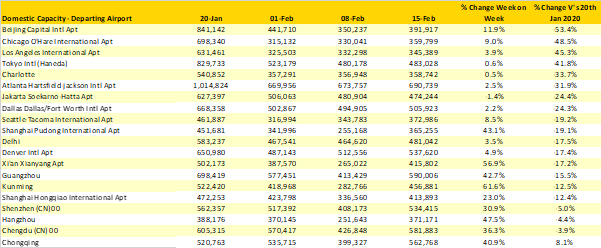
Looking purely at domestic capacity then the top twenty list naturally skews towards China and the United States with Tokyo Haneda, Delhi and Jakarta representing the rest of the world. Whilst in absolute terms the levels of capacity cut remain very high the percentage variance against pre Covid-19 levels is much lower, with the worst affected airport Beijing Capital at -53% and some of that will be accounted for by some capacity moving to Beijing Daxing.
Four of the largest twenty domestic airports are within 10% of their pre Covid capacity levels and they all happen to be in China where the switch of capacity from international to domestic services was perhaps one of the most impressive moves made through the pandemic, although airline profitability remains fragile. Chongqing in particular has seen capacity actually increase by some 8%; hanging on to that capacity growth as international markets recover may be a challenge for the airport.
Table 3- Scheduled Capacity Top 20 Airports, Departing Domestic Capacity
Source: OAG
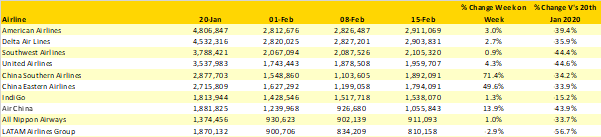
American Airlines are once again the world’s largest airline with some 7,200 more seats than Delta Air Lines; both carriers increased capacity week on week but a slightly more bullish 3% growth from American has allowed them to snatch the crown – there must be a regular shuttle running between Atlanta and Dallas!
The award for stat of the week goes to China Southern who added back nearly 800,000 seats compared to the previous week: that’s a bit like starting the whole LATAM operation in just seven days! They were of course running capacity at similar levels two weeks early but the “stop – start” nature of that operation will have required some level of planning and frustrated numerous suppliers.
Table 4- Scheduled Capacity Top 10 Airlines
Data for the next few weeks suggest little change to the overall levels of capacity, some modest switching of capacity, a change in the world’s largest airline likely and a few movements in the top twenty country listings. That aside the whole industry feels like it is waiting in the departure lounge, waiting for the early snippets of good news around vaccines and reducing infection levels to result in lockdowns being eased. Maybe, just maybe, we are beginning to finally see the tide turn.
Stay safe everyone.