
Does Network Stability Equal Network Profitability?
Covid-19 has stretched the creativity of every airline network planner in the last twenty months as they changed airline schedules on a weekly or even daily basis in response to various lockdowns and changes in policy. At OAG we have seen exponential increases in schedule updates arriving from airlines around the world, and although it proves the creativity and resilience of an industry caught in a crisis, we all want to see stability return to airline schedules.
Airline network stability is a key indicator of the state of the industry. If airline schedules are stable then airports, suppliers, travellers, and everyone in the travel eco-system can plan and work as effectively as possible. Airlines crave stability, it means they have the right schedules, capacity, connectivity and probably the best profitability; airlines that are chopping and changing schedules all the time are struggling to find their place in the market, constantly switching to find better uses of their capacity and it can be an early warning sign of deeper-rooted issues.
In the past twenty months, every airline in the world has been making regular schedule changes and now that there appears to be an aviation recovery underway, we wanted to see just how hard some airlines have been working to match capacity to any demand.
Domestic Is Best
From the outset of the Coronavirus pandemic, we noted how those markets with a large domestic airline network were at least in capacity terms proving more resilient than those with a large international network.
Country markets such as the United States, China and Russia from a capacity perspective outperformed markets such as Singapore, The United Arab Emirates and Hong Kong for instance; the profitability from those networks may have been something very different.
The US Domestic market was clearly one of those markets with around 80% of domestic capacity having been operated since April 2021 and for several reasons we’ve taken a deeper look at how that market behaved. With a range of competing airlines, carriers from legacy, low cost and ultra-low-cost sectors all competing across numerous routes and markets with limited regulatory approval for new routes in place, the market provides a perfect backdrop for such a piece of analysis.
Our methodology was simple, we took the weekly capacity offered by each of the major carriers since April 2021 through to the end of 2021. We then identified the highest and lowest weeks of capacity for each airline, from this we calculated the range of network stability that they operated in 2021. The results were fascinating.
Across the ten largest US domestic carriers average capacity flexed by nearly 40% from April onwards, with the average level of capacity being around 16.3 million seats a week across those airlines. However, the relative stability of those carriers’ networks was very different; taking Southwest Airlines as an example, their busiest week of the year was week commencing the 30th August and their lowest week the 12th April.
The range of movement in capacity also appeared to be consistent across all carriers regardless of segment type with the notable exceptions of Allegiant Air and Hawaiian who were both considerably above the groups average whilst United Airlines and JetBlue were also busy adjusting capacity on a very regular basis. The most stable two carriers were Alaska Airlines and Delta Air Lines, and it may be no coincidence that in normal times these two carriers feature highly in the OAG monthly punctuality reports that we publish.
Table 1 – US Domestic Network Volatility, Top 10 Scheduled Airlines, April – December 2021
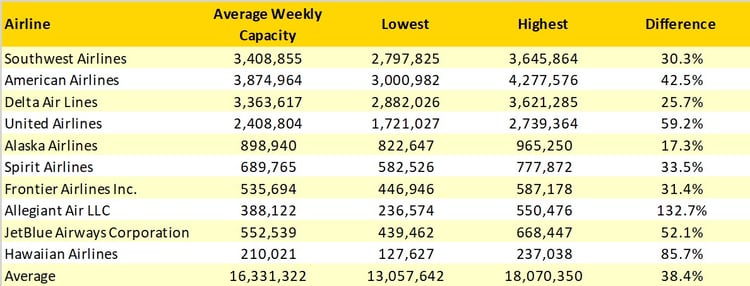
Source: OAG Schedules Analyser
Interestingly the highest and lowest capacity weeks for all the carriers were not always the same as the table below illustrates.
Table 2 – US Domestic Capacity, Peak High & Low Weeks by Airline, April – December 2021
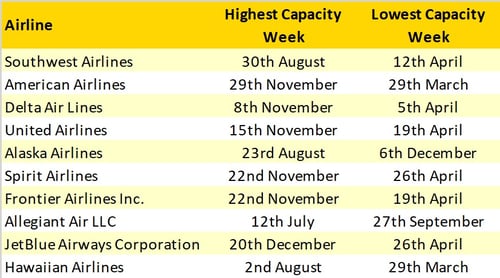
Source: OAG Schedules Analyser
For most carriers, the weeks leading up to the Thanksgiving holiday are proving to be the busiest which is no surprise, consumer confidence is stronger, leisure demand is strong and there will be an element of international demand that has not been seen for a very long time. There are of course exceptions, the most notable being Allegiant who were at their busiest in the middle of July, the peak summer vacation season and reflective of their strong presence in that market whilst Southwest, Hawaiian and Alaska Airlines maxed out in August.

2019 Capacity Highlights Current Volatility
Of course, the last two years have been exceptional for all the wrong reasons and airlines have had to adjust capacity in line with changing market conditions, state controls and other factors outside of their control. With that in mind, we compared this year’s data to 2019 - the last year of normality and one that we will all probably be using as a reference point for a few years to come.
Table 3 – Comparison of 2019 & 2021 (April – December) Network Volatility, Top 10 US Domestic Airlines
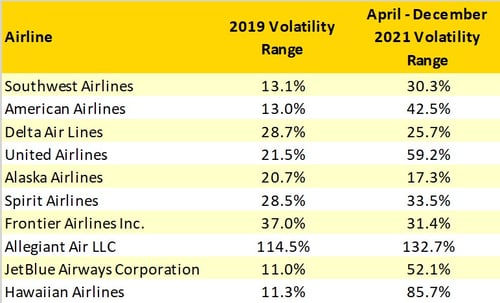
Source: OAG Schedules Analyser
In 2019 the levels of airline capacity adjustment between the busiest and lowest capacity weeks of the year were much less pronounced than what we have seen in 2019. For half of the carriers, their capacity range was less than 20%, and indeed four of the airlines operated with less than a 13% differential across the 52 weeks of the year: a remarkable level of stability. However, the exception to the rule was once again Allegiant who were almost as flexible in their capacity production in 2019 as they were during 2021 which reflects the unique and very flexible nature of their regular operations.
It’s clear that every airline has worked their way through the pandemic adjusting capacity on a near-daily basis and most carriers in the US domestic market have similar levels of change occurring on a weekly basis. Allegiant are clearly an exception to the rule but their flexible operating model with a very high leisure focus has for many years distinguished them from others. But how have some of the major US domestic routes fared in terms of capacity?
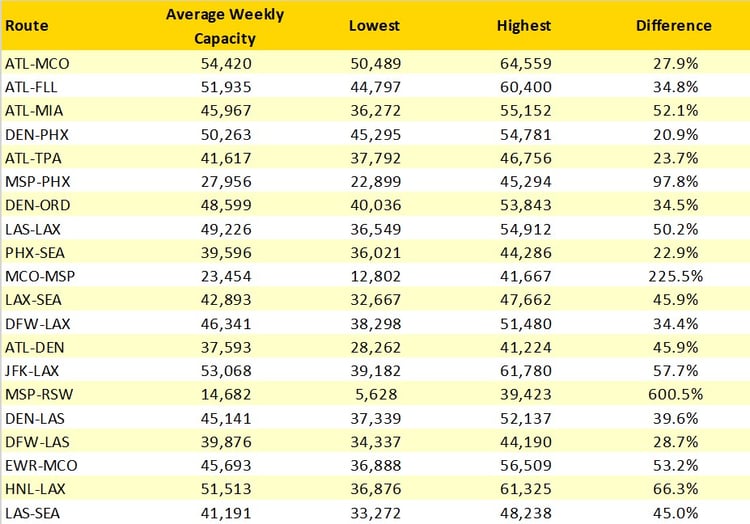
From April 2021 the levels of capacity change are very similar across the largest twenty domestic routes, with one notable standout airport where the levels of capacity change are significantly larger than anywhere else, and that is Minneapolis/St Paul where perhaps surprisingly Delta Air Lines with a 74% capacity share have been the major airline operator averaging around 750,00 seats per month from the twin cities since June of this year. For any major airport, high levels of volatility can be frustrating, impacting asset utilisation and terminal facilities on a regular basis; no airport wants more departure gates than they need!
Table 4 – Top 20 US Domestic Routes April – December 2021 and Network Volatility
Source: OAG Schedules Analyser
Network airline volatility is just one intriguing operational metric that we should perhaps follow more closely than we normally do, and it has traditionally been a solid indicator of an airline’s fortunes and position in a market. Adjusting capacity for seasonal changes is nothing out of the ordinary and indeed is good business practice, but constant change in ‘normal’ times is suggestive of an airline struggling to find its way, Allegiant Airlines perhaps being the classic exception to the rule! As the airline industry around the world returns to its new normal levels of capacity and demand, monitoring this volatility will be one way of determining how each carrier is performing using some simple data analysis.