

Optimism continues to build in the recovery with weekly capacity increasing once again week-on-week with some 57.9 million seats or nearly 58 million planned over the next seven days as the Summer Season is now only two weeks away.
It may only be a 1.4% increase on last week’s capacity and we remain at 54% of pre COVID capacity levels but a steady climb in the right direction appears underway. In March some 19,502 unique airport pairs will be operated by the 407,500 scheduled flights delivering an average frequency of 25 flights per route; it’s amazing what trivia numbers can produce! Buried in that trivia is however, an interesting pattern of development over the next few months as more airport pairs are added back across all markets.
Before we all get carried away though scheduled capacity for April has fallen by some 10 million seats week-on-week as airlines adjust their schedules to reflect the latest changes in travel restrictions and demand. At the same time May has seen a very modest two million additional seats added back into the market and certainly in the United Kingdom the 17th May is a pivotal date with international travel expected to return. Let’s hope that is the case!
.Chart 1 – Scheduled Airline Capacity by Month
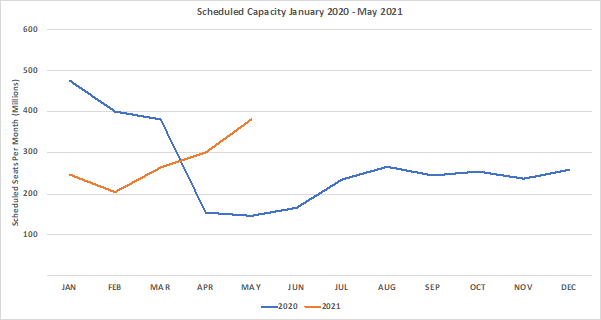
Source: OAG
The recovery in capacity across the top largest regional markets of North East Asia and North America equates to a week-on-week capacity increase of over 2 million seats and yet that only translates into a global increase of 560,000 seats. It doesn’t take a genius to work out that other regional markets have therefore seen some cuts in capacity week-on-week. For every step forward we continue to see some small slips backwards.
Confidence in the North American market continues to grow with another 1.4 million seats added back week-on-week. All of that growth was of course in the domestic market with major international destinations still effectively closed; in the United States over 90% of all capacity on offer is within the domestic market and we sometimes forget that even in normal times less than 15% of all capacity from the United States is allocated to international services.
South East Asia capacity may appear significantly down week-on-week, but this actually reflects a correction in the data supply being received from some of the major carriers who are consistently changing capacity at short notice. All three South American regional markets report week on week reductions in capacity as airlines adjust capacity to the latest spike in infection levels being reported on the Continent.
Table 1– Scheduled Airline Capacity by Region
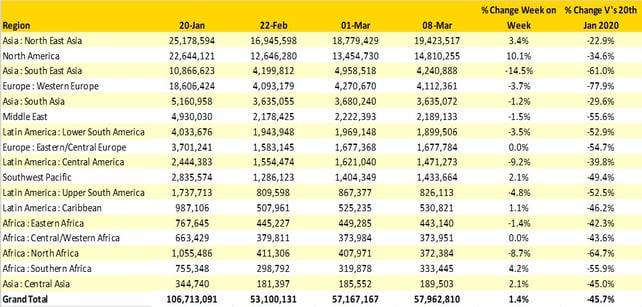
Source: OAG
China remains the largest country market but the gap is closing each week as more and more domestic capacity is added back in the United States; although without the all-important and very valuable international capacity it will be hard for the US to reclaim the top spot. Indonesia’s dramatic reduction is a function of adjusted data supplies from the major low cost airlines whilst Mexico is another market with a double digit decline in capacity. All three Western European markets in the top twenty reported week on week capacity reductions and the United Kingdom has now fallen to 25th place with another 52,000 seats removed week on week. And finally, in a surprising development Iran enters the top twenty (not often you can get to say that) with replacing Canada where capacity has fallen by some 10,000 seats.
Table 2- Scheduled Capacity, Top 20 Country Markets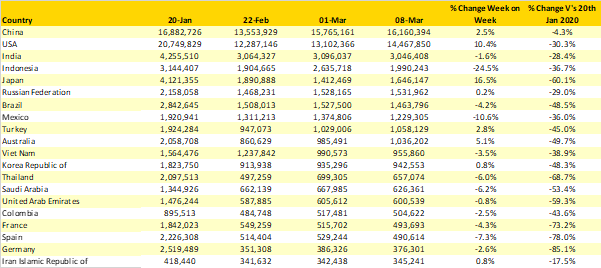
Source: OAG
Both American Airlines and Southwest have added large chunks of capacity back this week ahead of the seasonal holidays and spring break season with Southwest in particular adding back over 600,000 seats a week and now climbing above China Southern into 3rd position amongst the top ten global carriers.
Proving that Group bankruptcy is no barrier to development, Hainan Airlines have entered the top ten carrier list with a staggering 45% increase in capacity week on week, that may seem remarkable but similar levels of capacity growth have been added by other major Chinese carriers in the weeks after the new year holiday.
Table 3- Scheduled Capacity Top 20 Major Country Markets Capacity Declines
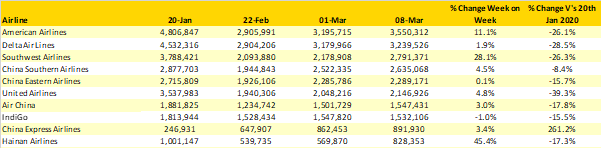
Source: OAG
Slowly but surely, it feels that week on week capacity is recovering at least in the major regional markets and the key question remains around traveller confidence as we look ahead into the second quarter of the year. Domestic capacity remains much stronger than any international recovery and the industry eagerly awaits news on vaccine passports and the global acceptance of such a programme would obviously help in that regard; fingers crossed for more news on that front in the next few weeks.
Stay safe everyone.