As the long journey towards an aviation recovery begins, it’s a good time to look at what impact the COVID-19 crisis is having on flight punctuality.
It won’t come as a surprise to know that On-Time Performance (OTP) has improved with the reduction in flights, particularly at the scale of reduction that the aviation industry is currently experiencing. Taxiways are not congested, airports are not operating at capacity, and airspace is currently unconstrained – essentially many markets still remain closed to each other, and people are not yet free to travel without a complicated set of quarantine and testing requirements.
Tracking of OTP hasn’t stopped throughout the COVID-19 crisis, however, OAG paused the release of its Monthly OTPs and Punctuality League tables while there was very little passenger-related aviation activity during 2020. After a year on hold, OAG’s Monthly OTP data is back and you can now track the world’s largest airlines and airports throughout the year with the all-new online Punctuality League.
How we measure OTP at OAG
OAG measures OTP by calculating the percentage of flights that arrive within 15 minutes of their scheduled arrival time – that is based on the gate arrival or departure time for airports (including cancellations) and for airlines, gate arrival times are used.
Monthly OTP data includes all airlines and airports (regardless of size) and tracks their OTP performance each month. Only airlines and airports who then meet OAG criteria are given a number rank by OTP and data can be filtered by region and by specific airlines or airports. Other airlines and airports are still listed but do not receive a rank.
The OAG Punctuality League tracks the year-to-date position of the world’s largest airlines and airports. It only includes airlines with over 250,000 ASKs (Available Seat Kilometers) on an annualised basis, and airports with over 2.5m departing seats, also based on a rolling annual total. A number of categories are tracked including Top 10 OTP performance for mainline and LCCs (Low-Cost Carriers), and performance for carriers by region. For airports five categories are tracked ranging from Small to Mega, based on the annual capacity.
Inclusion is also strictly based on OAG access to flight status data for at least 80% of all scheduled flights operated by an airline or airport.
The 2021 Story So Far...
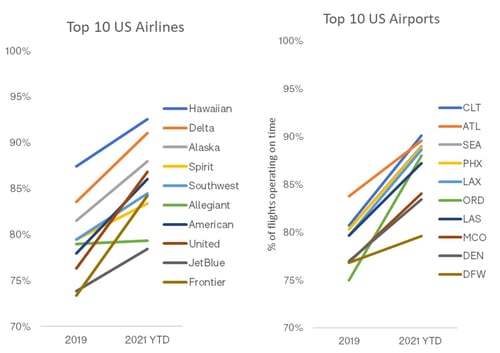
For the five months to May 2021, the average OTP for the world’s biggest airlines reached 84.1%. Back in 2019, the average OTP for this same group was 76.8%, so a full 7 percentage points improvement and more. In 2019, there were 102 qualifying airlines in the Punctuality League and currently, there are 57. This month there are 13 airlines operating with OTP of 90% or over, compared to just three that averaged above 90% in the full year 2019. Currently top of the list is Thai Air Asia, which is recording OTP of 98.2%. Operating just over a quarter of the flights they operated in 2019 for the same period, Thai Air Asia is serving the Thai domestic market currently from its base in Bangkok’s Don Mueang airport. The airport is also operating at just 26% of 2019 YTD capacity levels, meaning there is plenty of capacity to go around.
Source: OAG Mapper
Looking to the West, the US domestic market is closer to recovery, with frequency currently operating at nearly three-quarters of 2019 levels. In May 2021, frequency within the US was sitting at just 26% below May 2019. OTP for US carriers is sitting at 85.1%, up from an average of 78.1% in 2019, as carriers benefit from less congestion on the ground and in the air.
Looking across to the biggest US airports shows a similar picture. There are 72 US airports that qualify for the Puntuality League and their average OTP is 87.2%, up considerably from the 2019 average of 79.5%.
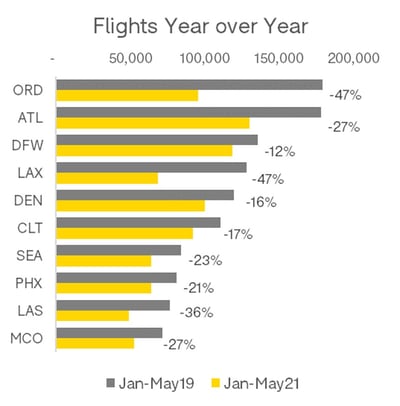
The biggest of these airports have all seen OTP climb by an average of 8 percentage points increase between 2019 and the position for the year to date. Chicago O’Hare (ORD) is at the upper end, with an increase of 13 percentage points, up to 88% of flights arriving on time.
Source: OAG Schedules Analyzer
Unfortunately for ORD, this increase is a result of the airport having seen flights fall by nearly 50% compared to the same period in 2019.
What does the future hold for OTP?
One of the many challenges that airports and airlines will face as recovery continues to build is passenger tolerance for delays. Anyone who has travelled during the pandemic knows that airports have been quieter, less chaotic places to be, in large part because there are far fewer other passengers. Whilst there will be some acceptance of the need for additional time for testing in an airport (be it temperature, checking COVID test results, etc) this acceptance will be challenged as airports begin to get busier again, and most likely the typical OTP performance we saw pre-COVID will be aspirational for some airports and airlines.
What constitutes ‘on time’ may need to be considered again. In a post-COVID world, the aviation industry will be wrestling with the increased journey times through airports created by additional testing measures, or vaccination confirmation processes, and even more complexity. Understanding the challenges and developing richer OTP data to adapt to a changing world has never been more important.




.jpg)




.png)


