
Capacity Remains Trapped As Major Markets Remain Closed.
Global airline capacity continues to bob along with a modest 0.5% increase week-on-week taking us above the 76 million mark once again. That may sound like a lot of seats, but during the same week in 2019 nearly 118 million seats were operated. Global capacity remains at around two-thirds of its normal levels and when passenger load factors remain lower in many markets than normal then the position looks as bad as Norwich’s chances of survival after one week of the premier league!
Having tracked the pandemic since January 2020 there are some regular patterns that you see every week and most of them continue to reflect the difficulties of recovery in a world where no two governments or agencies appear capable of applying the same rules. One of those patterns is the regular cuts in airline capacity for the next two months, this week another 20 million seats were removed through to the end of October - much of this is just airlines getting their capacity in order. However, all those 20 million seats are a potential change in travel bookings for those brave enough to book so far in advance of travel. It hardly helps build consumer confidence but then again airlines will rightly argue that they need clearer direction from policymakers, fingers crossed on that one!
Chart 1 – Scheduled Airline Capacity by Month
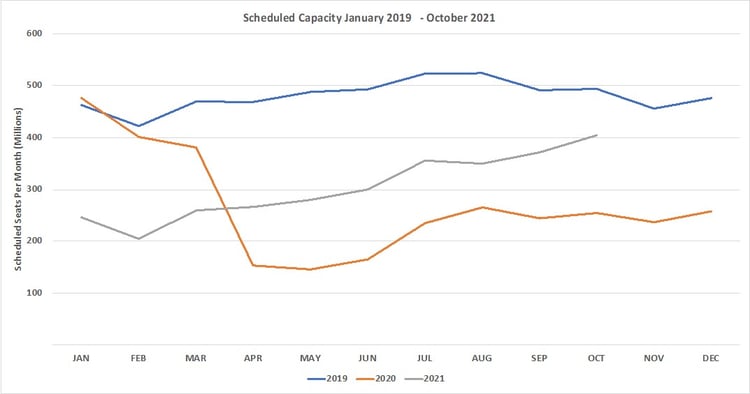
Source: OAG
The slight recovery in global capacity is based upon a significant increase in capacity in South East Asia this week and specifically Indonesia where there has been a regular pattern of capacity being added and then dropped. Nearly half of the regional markets report reductions in capacity ranging from nearly 8% in the Caribbean to less than 1% in Northeast Asia and once again this has become a regular pattern of small weekly changes across every region. Despite some pockets of optimism (the US domestic and Western European market, excluding the UK) most markets are still experiencing turbulence in their climb out from the pandemic; turbulence at any height is never a good feeling.
Table 1– Scheduled Airline Capacity by Region
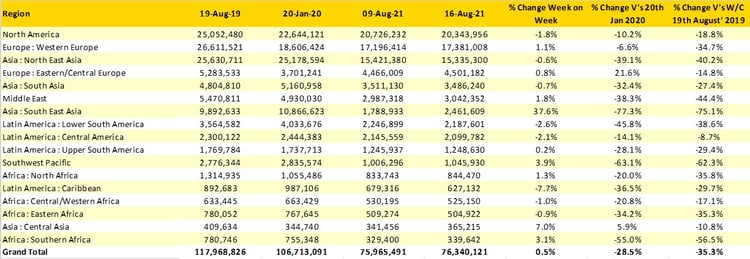
Source: OAG
The top twenty country markets remain unchanged, the USA continues to be the largest country market despite a 2% reduction in capacity as the school holidays end, for many US-based carriers the domestic market has been very strong this summer; quite how strong it will be heading into the traditional business and conference travel season will perhaps be another issue.
Only two of the largest country markets are operating with more capacity than in the same week in 2019; Russia and Greece and in both cases that growth is marginal. Greece is an interesting and rare example of a market that has held its own in the pandemic although the 263% increase in capacity this week versus January 2020 is perhaps more a reflection of the huge seasonality in the tourism industry.
Many of the major markets remain stranded, four of the top twenty have less than half of their 2019 capacity levels and seven of the top twenty have less than 60% of their January 2020 capacity. Despite the UAE now being added to the UK amber classification and Emirates and Etihad adding back services, the market remains at less than half of its 2019 levels as travel restrictions in South and North East Asia continue to impact connecting traffic.
Much of that connecting traffic used to be to Australia and New Zealand which are now effectively closed to international travel for the remainder of the year, and in the case of Australia domestic capacity remains subject to sudden and sharp state lockdowns. This week both Qantas and Jetstar have added back domestic capacity whilst Virgin Australia have cut around 30,000 seats a week from their network. Australia now ranks as the 22nd largest market in the world and New Zealand just makes the top thirty.
Table 2- Scheduled Capacity, Top 20 Country Markets
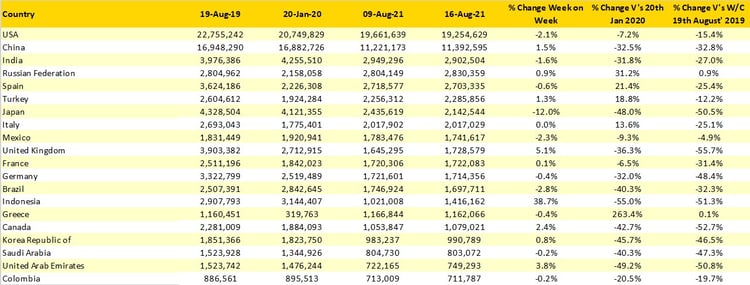
Source: OAG
Despite American Airlines dropping nearly 6% of capacity week-on-week they remain the world’s largest airline, at least from a capacity perspective with their closest competitors all making smaller adjustments to their capacity this week.
Table 3- Top 20 Airlines Capacity
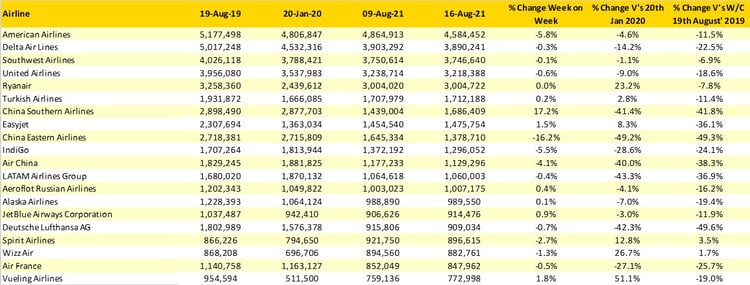
Source: OAG
This week’s data is one of the slowest we have seen this year in terms of capacity changes, that could reflect August being the peak holiday month or more likely that until either China or the USA reopen their borders for “normal” international travel then this could be as good as it gets and that’s a real worry for many airlines.
Stay safe everyone.
Recommended: