

Last December, United announced its biggest ever international network expansion from San Francisco (SFO), which included non-stop year-round service to Toronto and Melbourne, and seasonal services to New Delhi.
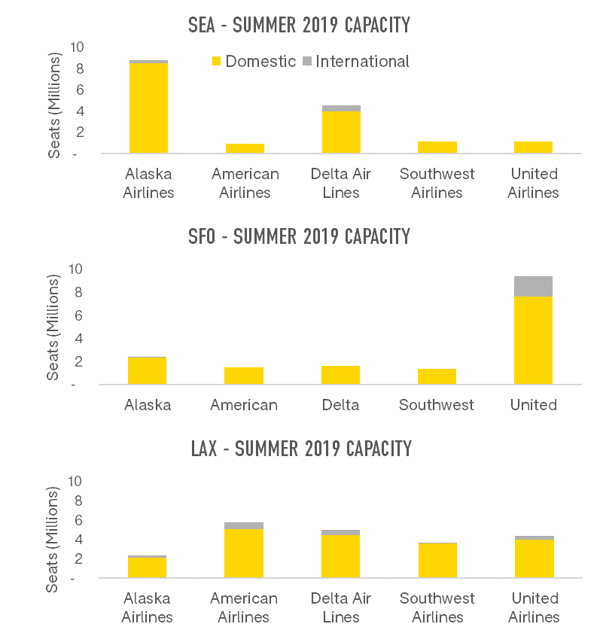
Six months on and analysis of United’s capacity at San Francisco shows they have more or less delivered. The summer 2019 season shows the carrier operating an additional 188,000 international seats at SFO compared to the previous summer, growth of 12%. United has strengthened its international position at SFO so that it now operates 34.7% of capacity this summer, compared to 30.2% last summer, and no other airline comes close in terms of international operations.
While United has added international seats, its domestic capacity at SFO is down. However, since overall domestic seats have fallen by 4.5%, United’s drop of 3.5% means that it has actually strengthened its share of domestic capacity at SFO, tipping it just over the 50% mark.
Source: OAG Schedules Analyser
Overall, airlines are operating fewer seats this summer at SFO but United is looking stronger. Meanwhile, at Los Angeles, capacity is also down but none of the major carriers appear to have been able to use the downturn to strengthen their position. The four largest airlines - American, Delta, United and Southwest - have each reduced capacity. Instead it is Alaska Airlines, JetBue, Volaris and Norwegian which have built their presence.
Contrast this with Seattle (SEA) where capacity has grown by 1.3%, thanks to a surge in international air operations by Alaska Airlines and a handful of overseas operators. Domestic capacity has actually declined but international capacity is up 19.5%.
As an airline, United has the highest proportion of international capacity of the US Majors, at 20% of seats. While this is surely strategic, providing some protection from the harsh competition in the domestic market, across the board the reductions in capacity will be just as strategic, enabling airlines to inch the yields up.
Taking advantage of the MAX
With plenty of media coverage about the grounding of the B737 MAX aircraft in the US this summer, it would be easy to think this would have a big impact on the aircraft being used by US carriers.
A handy new feature in OAG’s Schedules Analyser product allows us to look back and see what the summer schedule was just before the aircraft were taken out of service and compare that with the schedule as it is today. What it shows is that US airlines have pulled much more capacity from the market than could possibly be expected due to the MAX.
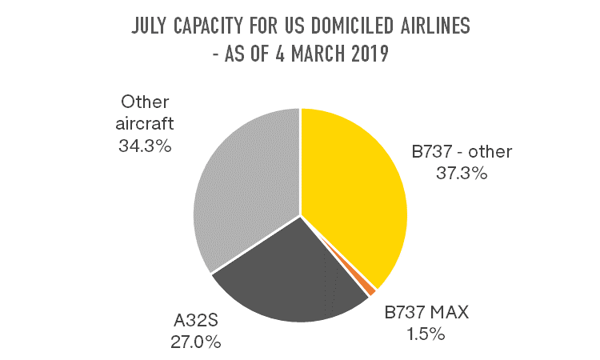
Looking at the July 2019 schedule on March 4th – the MAX made up just 3.4% of all 737 scheduled operations from US airports by US domiciled airlines. That was 8,142 flights and 1.4 million seats.
 Source: OAG Schedules Analyser
Put another way, the MAX accounted for just 1.5% of all US carrier capacity from US airports.
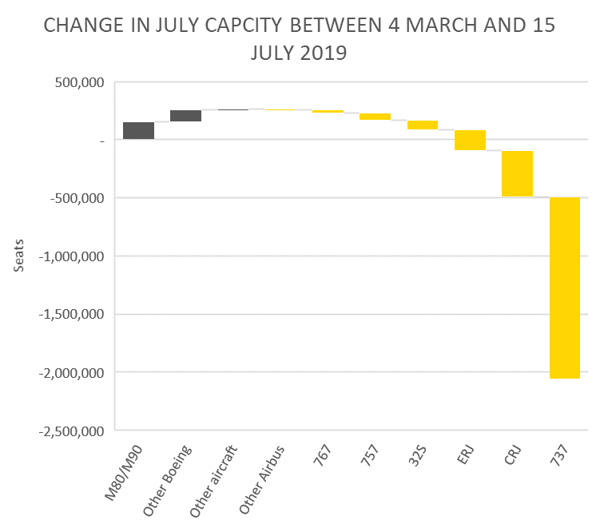
With these aircraft no longer in the skies, it wouldn’t be surprising if there was some reduction in summer schedule capacity, but it would also be expected that airlines might find a way to bring a few extra Boeing and Airbus planes of a similar size into service. The data shows otherwise. While there are more MD80’s and MD90’s in operation that would have been expected back in March, there are fewer aircraft in the Airbus 32S category (A319, A320, A321), accounting for 80,000 fewer seats than the March scheduled expected for July. There are also far fewer ERJ and CRJ operations, removing 575,000 seats. But most striking of all is that there are 1.6 million fewer B737 seats, more than all the MAX aircraft which had been originally scheduled.
 Source: OAG Schedules Analyser
The net reduction is over 2 million seats in the July market, compared to how July appeared back in March. While some variation to the schedule always occurs as the departure dates get closer, is this a case of some airlines using the opportunity to squeeze supply and seek marginal revenue gains?
The usual churn in European routes
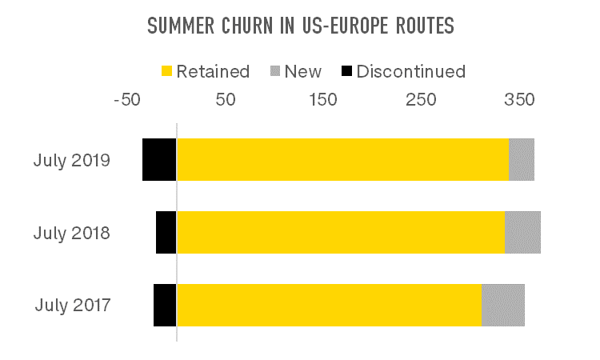
This summer sees the usual churn of routes on the transatlantic as airlines try out new routes and drop those that aren’t performing so well. There are 306 routes between the US and Europe which have been operated in July in each of the last three years on a scheduled basis, and 421 which have been operated in one or more of these years.
This July 9% of last years’ routes no longer have flights and 7% of all the routes being flown are new. That’s 26 routes which have had no scheduled services at least since 2010 but have flights this July.
 Source: OAG Schedules Analyser
Last July the figures were the other way around, with 6% of routes discontinued and 10% new.
|
US-EUROPE SCHEDULE ROUTES |
|||
|
|
Retained |
New |
Discontinued |
|
July 2019 |
339 |
26 |
35 |
|
July 2018 |
335 |
37 |
21 |
|
July 2017 |
311 |
44 |
23 |
Although this pattern of churn is fairly typical, the slightly higher volume of discontinued flights reflects, in part, the reduction in flights to Iceland. While there were 21 routes flown from US airports to Keflavik (KEF) in July 2018, the schedule this year has been reduced to just 14, while the number of flights has fallen from 1,055 to 608. The biggest losses have been Baltimore/Washington Airport (BWI) which had at least two flights per day last year, along with Cleveland (CLE) which had 41 flights through July.
|
JULY 2018 NEW ROUTES WITH MOST FLIGHTS |
||
|
Route |
July 2018 |
July 2019 |
|
AMS-STO |
31 |
31 |
|
ATL-LIS |
31 |
31 |
|
BUD-PHL |
31 |
31 |
|
CDG-IND |
31 |
31 |
|
EDI-IAD |
31 |
31 |
|
EWR-STN |
31 |
31 |
|
LGW-ORD |
31 |
31 |
|
ORD-VCE |
31 |
31 |
|
PHL-PRG |
31 |
31 |
|
JULY 2019 NEW ROUTES WITH MOST FLIGHTS |
|
|
Route |
July 2018 |
|
AMS-TPA |
31 |
|
ATH-ORD |
31 |
|
BOS-EDI |
31 |
|
DFW-DUB |
31 |
|
DFW-MUC |
31 |
|
EDI-PHL |
31 |
|
EWR-NAP |
31 |
|
EWR-PRG |
31 |
|
LGW-MIA |
31 |
When we look at the most ambitious new routes last year, there were nine which started with daily service and they’re all still in place this year. The only route with more initial capacity was Dallas/Ft.Worth (DFW) which started with double daily service and has been reduced to daily. In general, the discontinued routes are ones that had operated as daily services for a few years or were started the previous year with less than daily services.
This July there are also nine new routes which are being launched with daily services so if last year is an indicator, most will still be in place next year.
A number of airports appear in both lists – Edinburgh (EDI), London Gatwick (LGW), Newark (EWR) and Philadelphia (PHL). Is this because this is where the biggest opportunities lie or are these perhaps the most proactive in air service development?
In summary, the disappearance of WOW, the grounding of the 737 MAX aircraft and judicious scaling back - or tweaking - of capacity this summer provides a healthy environment for the major US airlines. The resulting balance between supply and demand, combined with careful yield management, should enable yields, and ultimately profits, to rise.