

Helping Passengers Make Greener Choices
A year ago OAG published its first report exploring the impact of environmental concerns on airlines, airports, online travel agents (OTA) and other providers, How Green is your Airline? looked at the numerous actions airlines are taking to improve the environmental footprint of flying.
One of the gaps it identified, however, was the provision of readily available data to help travellers make smarter choices when it comes to flying. When there is ample evidence that some aircraft and some operational practices lead to improved fuel efficiency, surely consumers are entitled to better information that allows them to choose between flying and not flying or offsetting the carbon footprint associated with their flight.
Green aviation serves as a way to improve aircraft efficiency and reduce noise pollution and greenhouse gases, which in effect reduces carbon emissions. Airlines and airports have been taking important steps to ensure that the industry evolves through providing environmentally sustainable and green airline options.
However, OAG realised not just accessing this data but that transforming this data into meaningful insights for the industry was where the real value is to be found.
Our Data Science team is currently leading a series of projects combining an extensive network of data with predictive analytics and new technology to create additional value across the ecosystem. One such project is focussed on the environmental impact of air travel.

In this, the first of several blogs, we analyse existing schedules, fleet data and fuel usage to build a richer picture to identify the greener flight options for a specific route.
Wide Variation in Fuel Burn
Rather than look at fuel burn for specific routes, we take an overview to see just how different fuel burn can be between airlines. Indeed, some appear to be much greener than others and the major reason why is the aircraft they operate.
The analysis provided looks at three major corridors for air travel, the Transatlantic (defined as all flights between the Americas and Europe, Middle East and Africa), within Europe and within South East Asia. The first of these is a long-haul travel corridor, while the other two are short and medium haul travel regions.
The data used is from September 2020 and, of course, this is data from a period when airlines were still mired in the problems associated with COVID-19 – limited demand for air travel, onerous restrictions on international travel and domestic movement in many countries, and the need to preserve cash in order to be able to remain a going concern. In so many ways September 2020 can be considered atypical, and yet the airlines listed below were still flying, still carrying some passengers and were making adjustments to their fleets and schedules to optimise performance. In grounding some of their aircraft, many airlines were shifting the balance of their operating fleet towards the newer and more fuel efficient aircraft in order to leverage the route performance metrics available to them.
The analysis draws on Available Seat Kilometers (ASKs) operated by each airline and fuel use per ASK. Of course, each airline operates with different seat configurations, some flying aircraft with many more seats than others. Equally, some airlines – at least in normal times – have higher load factors than others meaning that the carbon burden of a flight is spread across many more fare paying passengers. The choice of aircraft type, seat configuration and target load factor will be different for each airline and may affect how they are ranked in this analysis but, from the perspective of a consumer concerned about their choices, fuel use per ASK seems a credible way to make comparisons.
Despite global movements to get individuals to reduce the environmental impact of air travel, the responsibility is still on the aviation industry and governments to evolve green airline options.
Dreamliners Offer advantage on the Transatlantic
Of the 12 airlines with transatlantic operations in this analysis, there will be wide variation in the length of transatlantic routes operated. Almost certainly the average Turkish Airlines flight between Europe and the Americas will be longer than the average British Airways flight. That aside, there are insights to be gained.
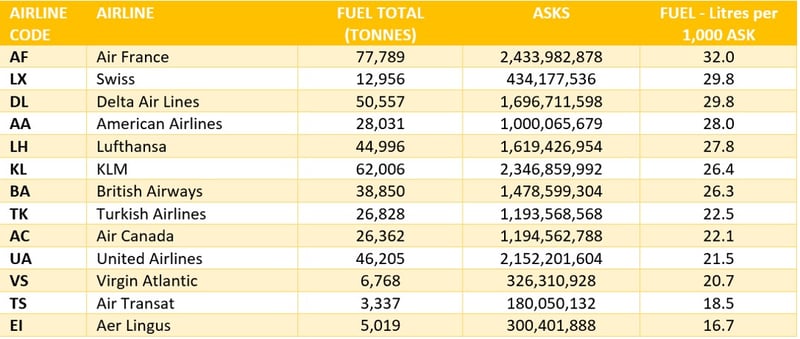
Source: OAG Emissions Data
The most fuel efficient of these airlines are burning around half the amount of fuel per Available Seat Kilometre (ASK) as others. If they operated with the same load factors then the carbon footprint of some is twice that of others, at least when it comes to fuel used, a major part of any airlines’ footprint.
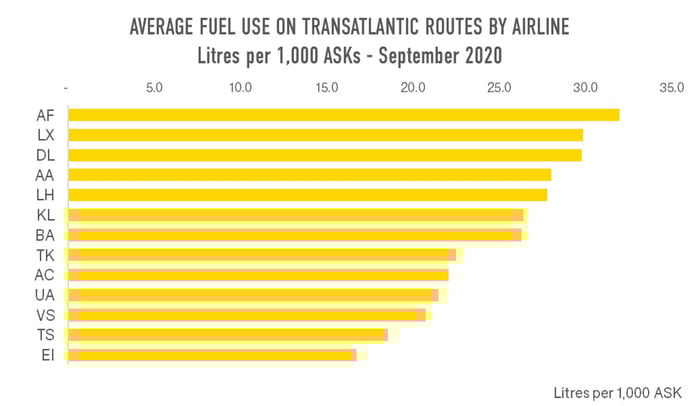 Source: OAG Emissions Data
Comparing the chart above with the one below, shows the fleet composition of each of the airlines listed, in the same order. Eight of these 13 airlines operate Dreamliners (shaded grey), and it would appear that the more that these aircraft make up their fleets the better the average fuel use. This isn’t surprising, of course, but does go to show how much the fleet mix affects overall fuel use. Similarly, with the exception of Aer Lingus, the airlines making more use of A330’s (yellow) typically have worse fuel use.
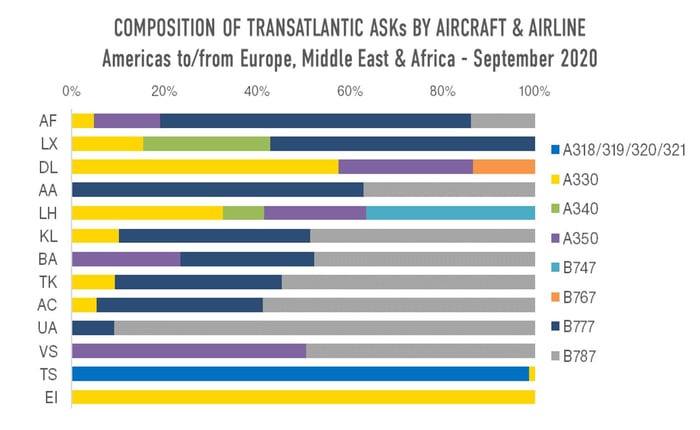 Source: OAG Emissions Data
Hence, by diversifying fuel type and using sustainable aviation fuels, this will serve as a means of encouraging green aviation.
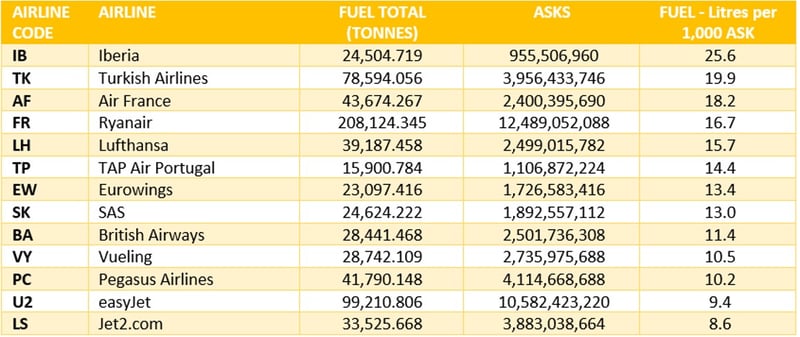
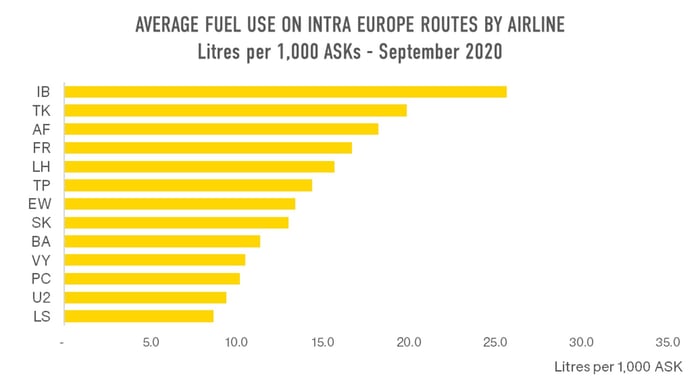
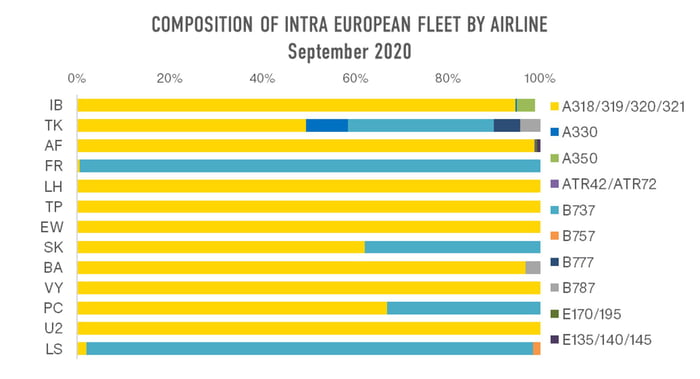
Intra Europe: Is performance about more than aircraft age and model?
Inevitably, the average flight within Europe is shorter than on the Transatlantic. For the airlines in this analysis, the aircraft of choice is either part of the A318/319/320/321 family or part of the B737 family. But within these groups there are wide variations of age and performance. According to CAPA data, A320-200s are the most common aircraft in this part of the Airbus family and average just under 12 years while the A320-neao average just over 2 years. Can the variation in fuel use be attributed to variation in the age and model of the aircraft they each operate?
 Source: OAG Emissions Data
Fuel used by these airlines on intra-European routes varies between almost 26 litres per 1,000 ASKs down to below 9. That’s a very wide range. With the highest fuel burn per ASK is Iberia while towards the bottom of the list is Vueling, both Spanish Airlines, both part of the IAG group and, interestingly, with a similar mix of aircraft types. Most of their fleet used on intra European operations are part of the A318/319/320/320 family. At Iberia the mix of ASKs is 37% A320, 32% A320 (sharklets) and 25% A321, while at Vueling it’s 35% A320, 41% A320 (sharklets) and 20% A321? So, what accounts for the difference in fuel burn? The choice of airports may account for some of this difference. Flights which stack over major cities and requiring lengthy approach and departure routings are likely to use more fuel than flights using out of the way airports, as some low cost carriers are prone to do, although few airports were busy in September 2020 which this data captures.
 Source: OAG Emissions Data
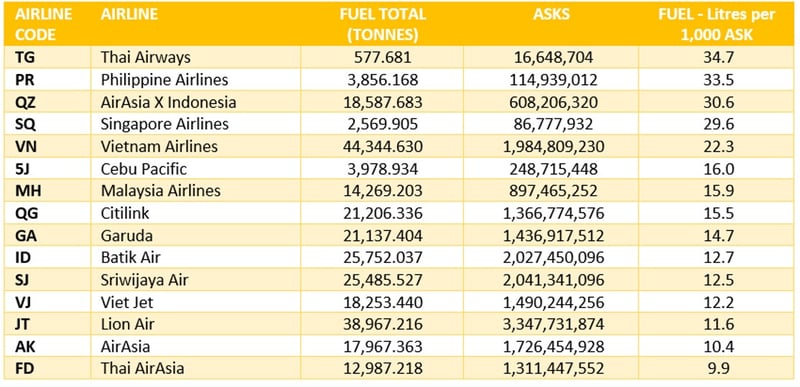
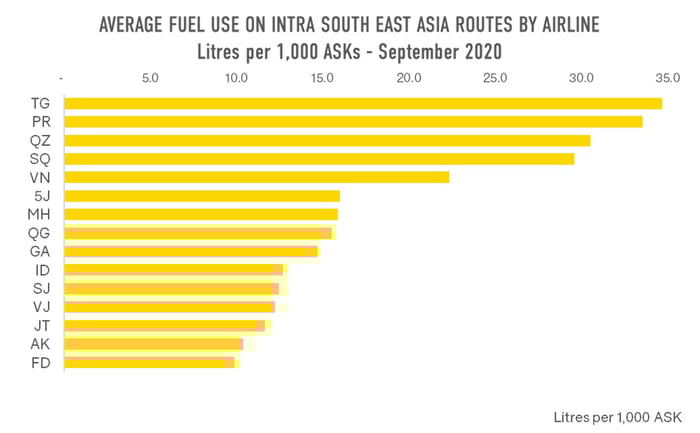
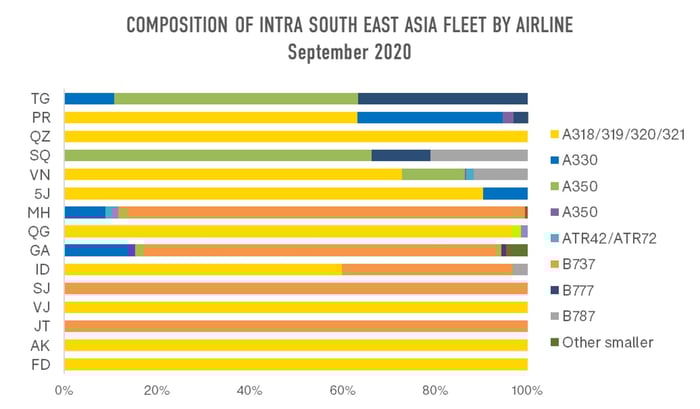
Intra South East Asia
Within South East Asia, the performance differential is even greater, with more than three times the fuel burn per ASK for some airlines than others.
 Source: OAG Emissions Data
At the top of the list are Thai Airways and Philippine Airlines, both operating a high proportion of long haul aircraft for their intra regional operations while AirAsia X Indonesia isn’t far behind with its A320 operation.
At the other end of the scale are Air Asia and Thai AirAsia, also with an all A320 operation. These numbers point to very different operating practices and a knock-on effect which will be felt on the airline bottom line.
 Source: OAG Emissions Data
Recognising that the use of wide body aircraft by airlines such as Thai Airways, Philippine Airlines and Singapore Airlines may not be a like-for-like comparison with the use of narrow-body aircraft by AirAsia and Thai AirAsia, but these numbers highlight the extent to which some airlines are not flying aircraft that are environmentally optimal for such sectors.
Fuel-efficient planes, sustainable aviation fuels and carbon offsetting are deemed as the most feasible environmentally friendly option as it relates to eco travel.
Uncomfortable Numbers: Spotlight on Performance
Being able to publish data which draws attention to airline performance, and specifically the environmental impact of air travel and climate change, with a view to giving consumers the information with which to make more informed decisions may be uncomfortable for some airlines – and good news for others. Will this be a new area in which airlines will compete for customers as we emerge from a couple of turbulent years? If so, airlines need to be ready.
About the OAG Data Science team
Established in 2019, through leading edge technology, the team specialises in using predictive analytics, processes, and algorithms to deliver additional value and insight from flight information data. The team partners with key industry organisations to trial, test and bring new initiatives to life.
If you would like to know more about existing and future projects, please contactus@oag.com
Related OAG content: