Another one million additional seats added back week-on-week, carry on at this rate and capacity will be back to pre-pandemic levels by this time next year; if only it was that simple. Whilst the recent pattern of capacity growth is positive, new spikes of COVID in Eastern Europe and particularly Lower South America continue to cause concern whilst Japan’s airlines have announced capacity cuts of over 30% for April across their domestic networks.
Against that backdrop it is not surprising that an additional nine million seats have been removed for the rest of this month compared to last week and some 20 million in April; clearly no joke for network planners at the beginning of April then. Capacity for May has seen a slight reduction against last week’s plans, but most airlines are now looking at no more than six weeks forward which is probably around five weeks more than any of us!
Chart 1 – Scheduled Airline Capacity by Month
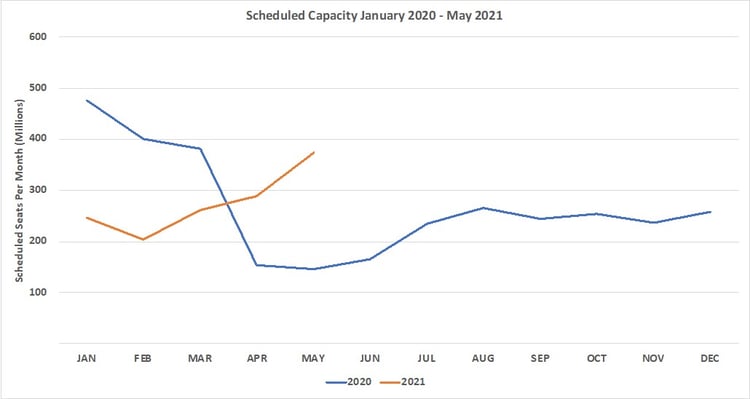
Source: OAG
Most geographic regions have in recent weeks reported steady growth week-on-week with North America leading the way; in the last month, capacity has increased by 20% with nearly all of that additional capacity operating on domestic services. TSA Checkpoint numbers for last week were running at around 55% of their 2019 weekly levels whilst capacity was running at 63% of the 2019 level; that would suggest that capacity is running slightly ahead of demand but as we know it’s challenging to balance the two variables at the moment.
Most worrying is the large reduction in capacity in Lower South America; a 15% reduction and the loss of some 293,000 seats week-on-week represents a large cut in capacity and nearly all of that capacity has been lost in the Brazilian market. Gol have reduced capacity by over 30% week-on-week dropping over 150,000 seats and LATAM (-73,266 seats) and Azul (-65,731) have followed with both Gol and Azul carrying those capacity cuts forward into April.
Table 1– Scheduled Airline Capacity by Region
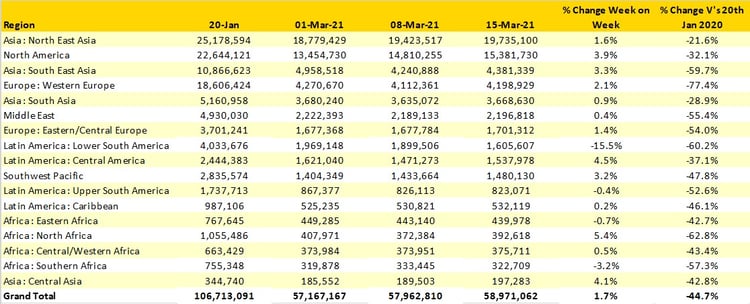
Source: OAG
Chinese capacity is nearly back to pre-COVID levels with less than a 4% differential to January 2020 levels; with international capacity remaining at less than 1% of all seats and fewer than 150,000 seats a week compared to over 2.1 million seats a week in January last year. We know that Chinese domestic services are not as profitable as international operations and with the price of fuel now some 73% higher than it was this time last year you would like to think that China’s airlines would be very keen to start flying internationally sooner rather than later; let’s hope that is the case.
Japan’s current capacity growth is a bit like their cherry blossom season; enjoy it whilst you can because it will disappear very quickly! We have already been advised of large capacity cuts in the April domestic schedules of all of the major carriers; all of which were filed on the same day, probably a coincidence more than coordination but you never know. We expect an announcement very shortly that overseas visitors to the Summer 2020 or 2021 Olympics will not be allowed, and if domestic capacity remains cut, precisely who will watch the games?
Finally, welcome back Vietnam! The return of some 117,000 seats week on week and 12% growth is impressive but unfortunately does not result in moving up the top country market; the country remains in tenth position. Australia’s additional 4% capacity keeps them just ahead of Vietnam with all four of the country’s major airlines adding some capacity week-on-week.
Table 2- Scheduled Capacity, Top 20 Country Markets
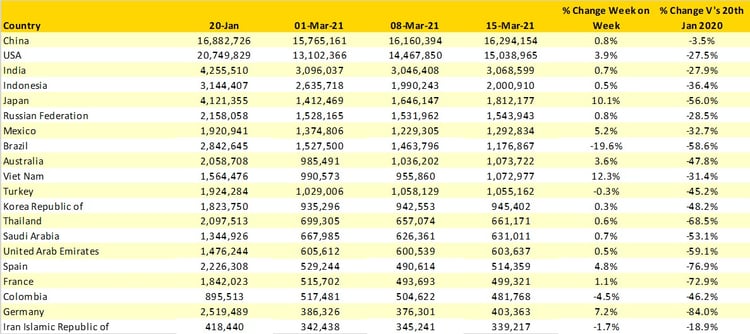
Source: OAG
There are no significant changes in the top ten airlines this week. American must have built a trophy cabinet in their DFW Headquarters as they hold on to the number one position for the fifth consecutive week. Southwest Airlines adding some 390,000 extra seats this week moves them above the three million mark and putting them within touching distance of Delta Air Lines for second place in the top ten.
In total some 652 airlines have filed capacity for this week compared to 715 that were operating in January 2020, a loss of 63 carriers or some 9% of all scheduled operators. Many of the losses are amongst the smaller regional carriers and some of those may restart services when local lockdowns ease but many of those services were also essential lifeline operations to local communities and need to return if at all possible.
Canada is a great example of airline churn with some 33 scheduled airlines operating last January and just 26 this week, a fifth of the airlines domiciled carriers stopping operations in the last year; including some relatively large carriers such as Porter Airlines and of course the now Air Canada owned Air Transat operation. Eleven of the airlines still operating have less than ten flights a day scheduled this week hardly enough to maintain commercial operations and highlighting the challenges in just one market.
Table 3- Scheduled Capacity, Top 10 Airlines
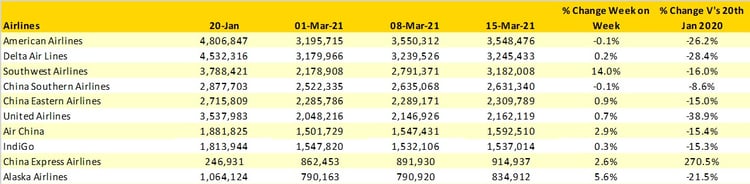
Source: OAG
The recent steady if not earth-shattering increases in global capacity are very welcome and reflect as much optimism rather than confidence in the recovery process through the next few months. There remain far too many variables for anyone to be really confident about the shape of a recovery, but vaccine passports and other initiatives are all helping to build some momentum. However, some localised outbreaks of COVID-19 are never good for the nerves!
And although not a huge concern at the moment the increasing price of jet fuel will begin to become an issue in the coming weeks. Airlines have had enough to contend with in the last year; they certainly don’t need any more fuel added to the fire!
Stay safe everyone.