
Summer Season Travel Airline Capacity Begins to Bounce Back & US Airlines Add New Airport Pairs in May & June
An “eggstraordinary” week for global capacity sees the weekly seat count crack through the sixty million barrier and reach 62.1 million, a 4% increase week on week and that’s the end of the poor “yolks”!
If all of the planned airline capacity materialises for this week then we are heading for the best week in over twelve months, which is a really positive point to carry into the new IATA Summer Season although of course demand is the more important measurement.It is very early but airlines appear to remain generally bullish around the summer season with airline capacity trending upwards in every month of the next two quarters: certainly, airline network planners would appear to be injecting more capacity into a vaccine populated world. Equally, on a more cautionary note, many airlines are just placing capacity into the market in hope of a Mexican wave of summer travel demand, and we can expect to see lots of changes in the coming weeks.
Chart 1 – Scheduled Airline Capacity by Month
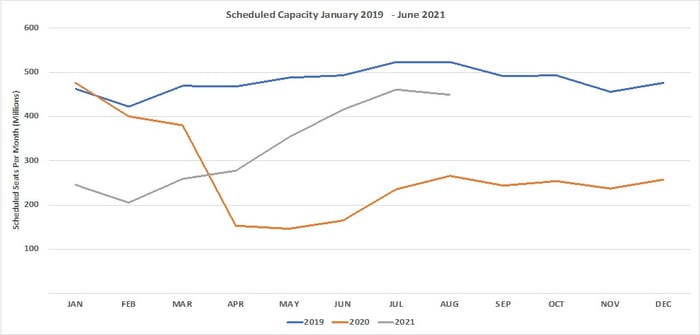
Source: OAG
The third coming of COVID-19 in Western Europe does not appear to be having any impact on airline capacity as we head to the holiday weekend with some 930,00 additional seats operating this week or a modest 20% growth week on week. Similarly Eastern Europe with 16% weekly growth probably reflects as much optimism and the realities of demand but airlines must be sensing a change in the market or are perhaps blinded by the longer daylight we now have after the clock change.
Other regional markets with strong growth this week are South East Asia (+10%), the Southwest Pacific (+11%) and North Africa (+13%) where in each case one country market is driving those levels of growth. In total all of the capacity growth leaves us still below 60% of the pre-pandemic capacity and despite all of the capacity growth in Western Europe the region remains the weakest market with less than 30% of its normal capacity. We still have a very long road to recovery ahead of us.
Table 1 – Scheduled Airline Capacity by Region
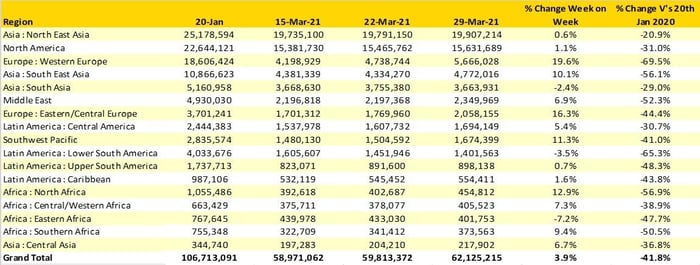
Source: OAG
Vietnam is an example of where one market can make a significant difference to regional airline capacity, a 26% increase in weekly seats and injection of 270,000 seats into the domestic market accounts for over 60% of the total region’s growth week on week. The remaining growth comes from a welcome return in airline capacity from Thailand where an additional 132,000 seats result in the strongest week this year for the popular leisure destination.
A number of major Western European markets report strong week on week capacity growth and perhaps the potential for travellers to have a row of seats to themselves if demand does not pick up rapidly. It’s hard to believe that demand will be strong enough to support 24% growth from Germany, the 21% growth from Spain or the almost incredible 49% growth in Italy; but this is perhaps a week when miracles do happen!
Across the top twenty markets only Brazil continues to report week on week capacity cuts with a further 70,000 seats removed; since the first week of March airline capacity has been cut by over one third as the country grapples with the latest outbreak of COVID-19.
Table 2- Scheduled Capacity, Top 20 Country Markets
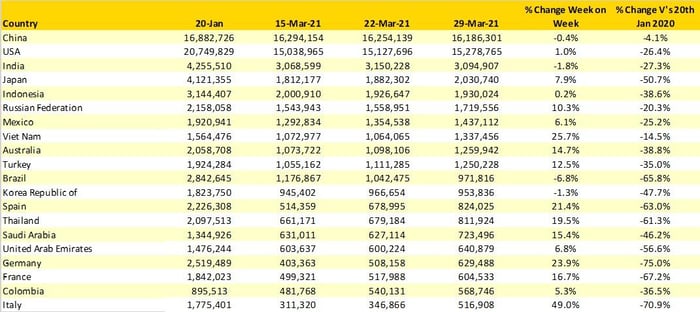
Source: OAG
The last few weeks have seen nearly all the major US based carriers announce a range of new destinations and services for the Summer, many of which are hub by-pass services responding to the stronger leisure demand that has a feature of the domestic market in recent months. In the table below we have tracked the growth in airport pairs that will be operated with numerous new routes being added in May and June from all the carriers; that should equate to a lot of new route “cakes” being cut across Florida where most of the activity seems to be taking place.
Table 3 – Scheduled Airport Pair Growth US Domestic Market Summer 2021
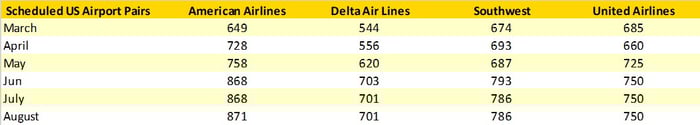
Source: OAG
For the many people who requested the return of the top twenty airline list; well one person really, the table is below. Whilst the top five carriers remain unchanged there is a little movement lower down the table with Turkish Airlines moving up one place to ninth after adding back some 170,000 seats; it seems a lot of effort to move one spot, but it does distance them from Alaska Airlines.
Highlighting how data and numbers can be interpreted in different ways. Qatar Airways rightly last week claimed to be the world’s largest airline based on ASK’s…based purely on capacity they rank in 24th place this week. Don’t you just love numbers!
Other notable developments include Aeroflot entering the top twenty at the expense of Spring Airlines and All Nippon Airlines re-joining the top twenty.
Table 4 - Top 20 Airlines
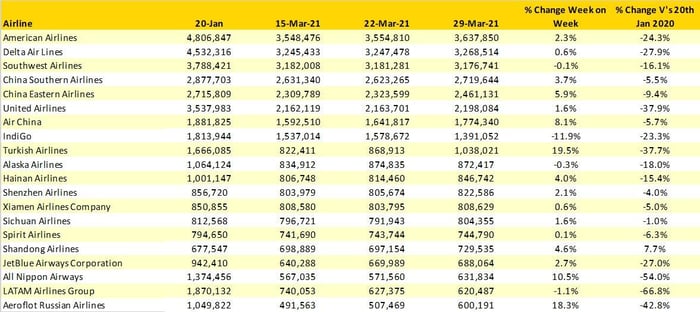
Source: OAG
This week’s data certainly brings a cracking range of capacity growth across most regional markets although of course the demand side of the equation is crucial and that in turn seems increasingly dependent on travel passports being rolled out in the coming months. The next four weeks are likely to be crucial in shaping the whole summer season which in turn for many airlines is when revenues are generated that carry them through the following winter season. We can but hope the various regulators and authorities realise how important their decision will be for a whole industry and make some brave calls. Fingers and toes crossed!
Stay safe everyone.