This month, our infographics, powered by OAG’s up-to-the-minute data, include an overview of the top aviation alliances in numbers; a visual representation of the USA’s top airports and airlines; the winners and losers of long-haul this summer and more.
Scroll through the infographics below and click an image to access full data and in-depth expert analysis.
How Have Flight Times Changed Year-on-Year?
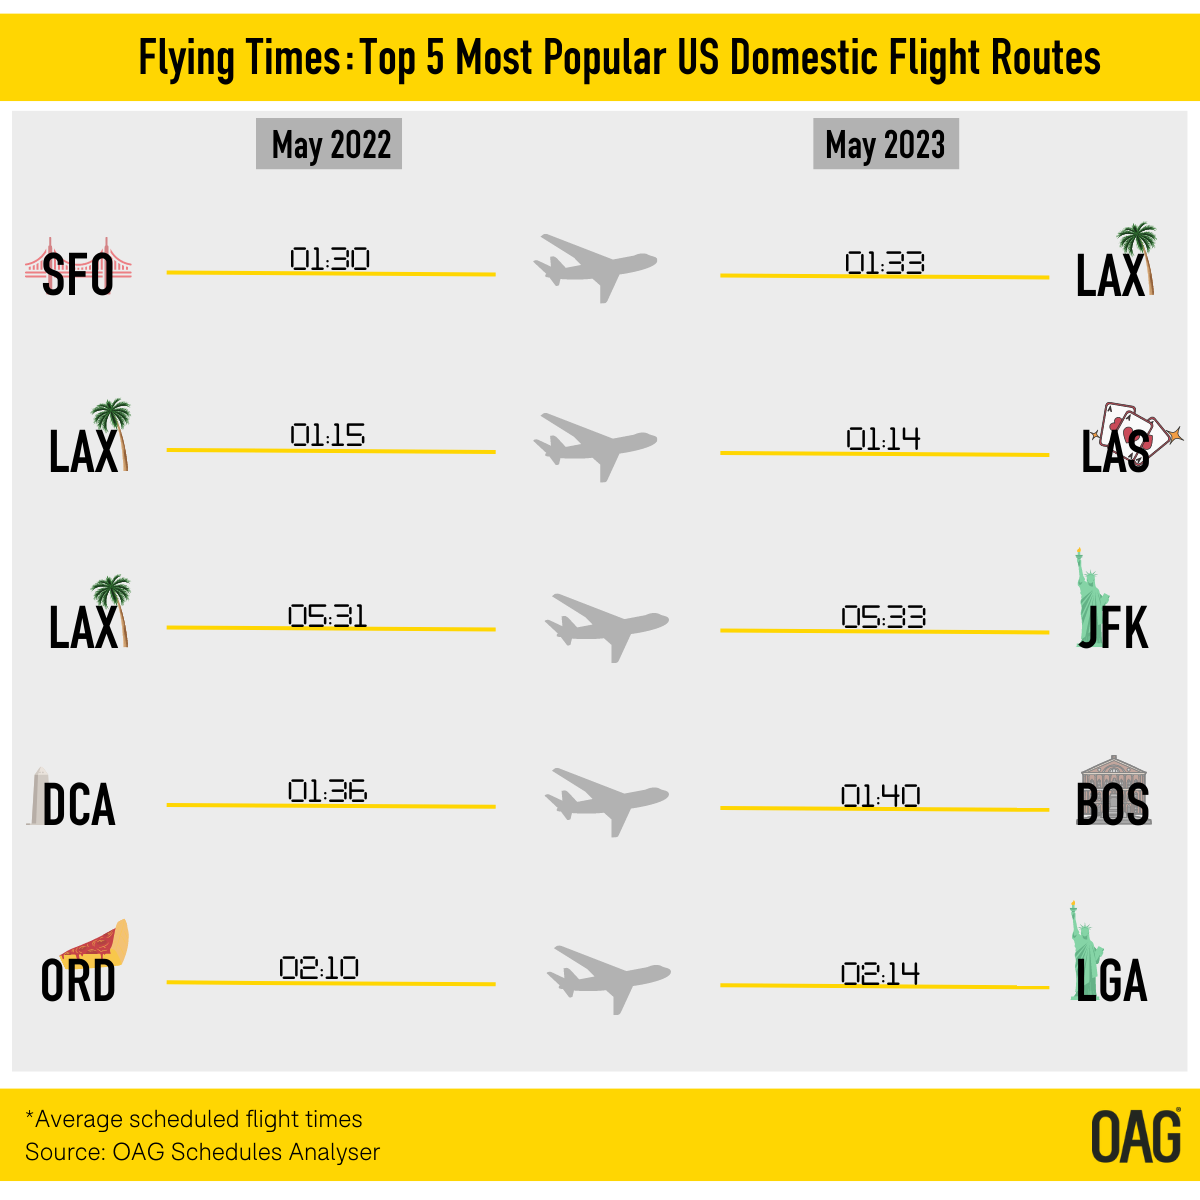
Hoping to avoid the kind of travel chaos experienced by many travelers last year, airlines are building operational resilience into their schedules. Key takeaways from this analysis include:
- Legacy airlines, in particular, have added a few extra minutes to scheduled flight times on some routes to provide a small buffer to help get the airline schedule back on track if there are delays.
- Regional aircraft flights are usually longer than those of larger aircraft.
- LCCs tend to have shorter flying times than legacy carriers.

Global Airline Capacity Reaches Its Highest Point Since First Week in 2020
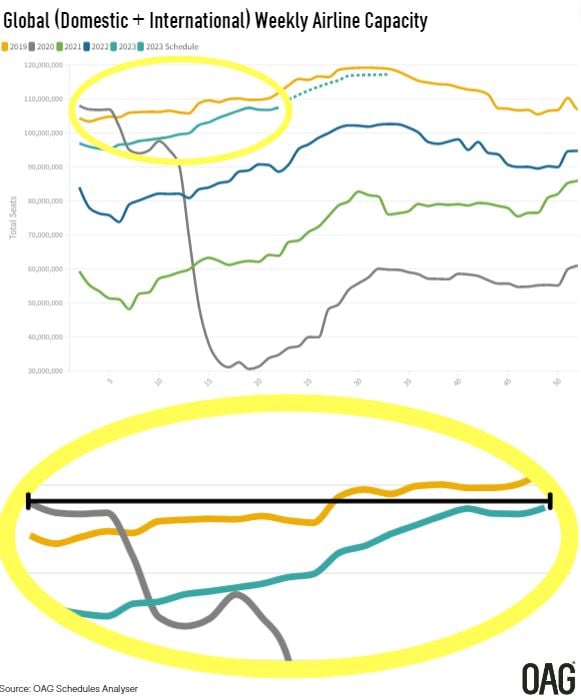
By zooming in on our weekly graph tracking the recovery of global airline capacity in the week commencing 22nd May, we're able to draw a straight line that shows the teal line representing 2023 has reached its highest point since the very first week of 2020 (represented by the gray line).Domestic airline capacity has surpassed the benchmark level of 2019 most weeks in May, while international capacity still has some way to go to recovery.

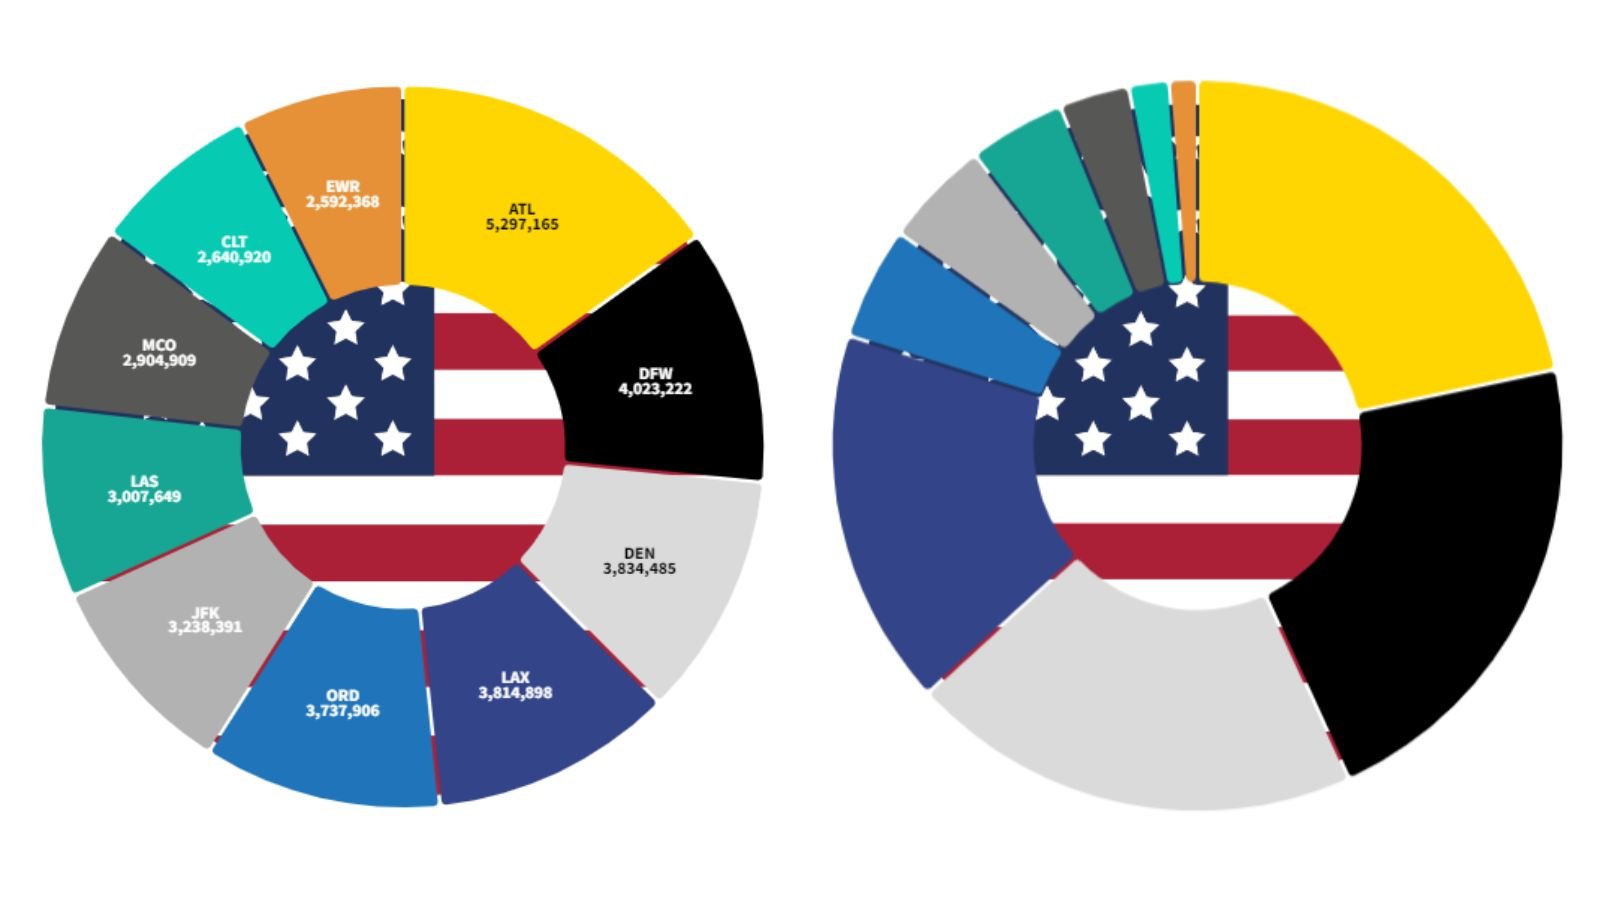
Atlanta Airport and American Airlines Top Lists in May 2023
.png?width=800&height=1150&name=US%20AIrports%20%26%20Airlines%20May%2023%20(4).png)
In the US, 665 airports have scheduled services in May. Of these:
- The largest airport is still Atlanta (ATL), handling 5% of all capacity at US airports.
- The Top 10 airports (based on seats) have all seen capacity grow between 3 and 5% vs last month.
- Capacity from the Top 10 airports accounts for 36% of all US airline capacity.
Looking at US airlines:
- American, Southwest, Delta and United account for 74% of US capacity.
- Allegiant Air decreased capacity by 10% in May, just over 180k seats.
- Delta added 800k more seats to their schedule compared to April.

Airline Alliances Offer Value Despite Challenge From LCCs
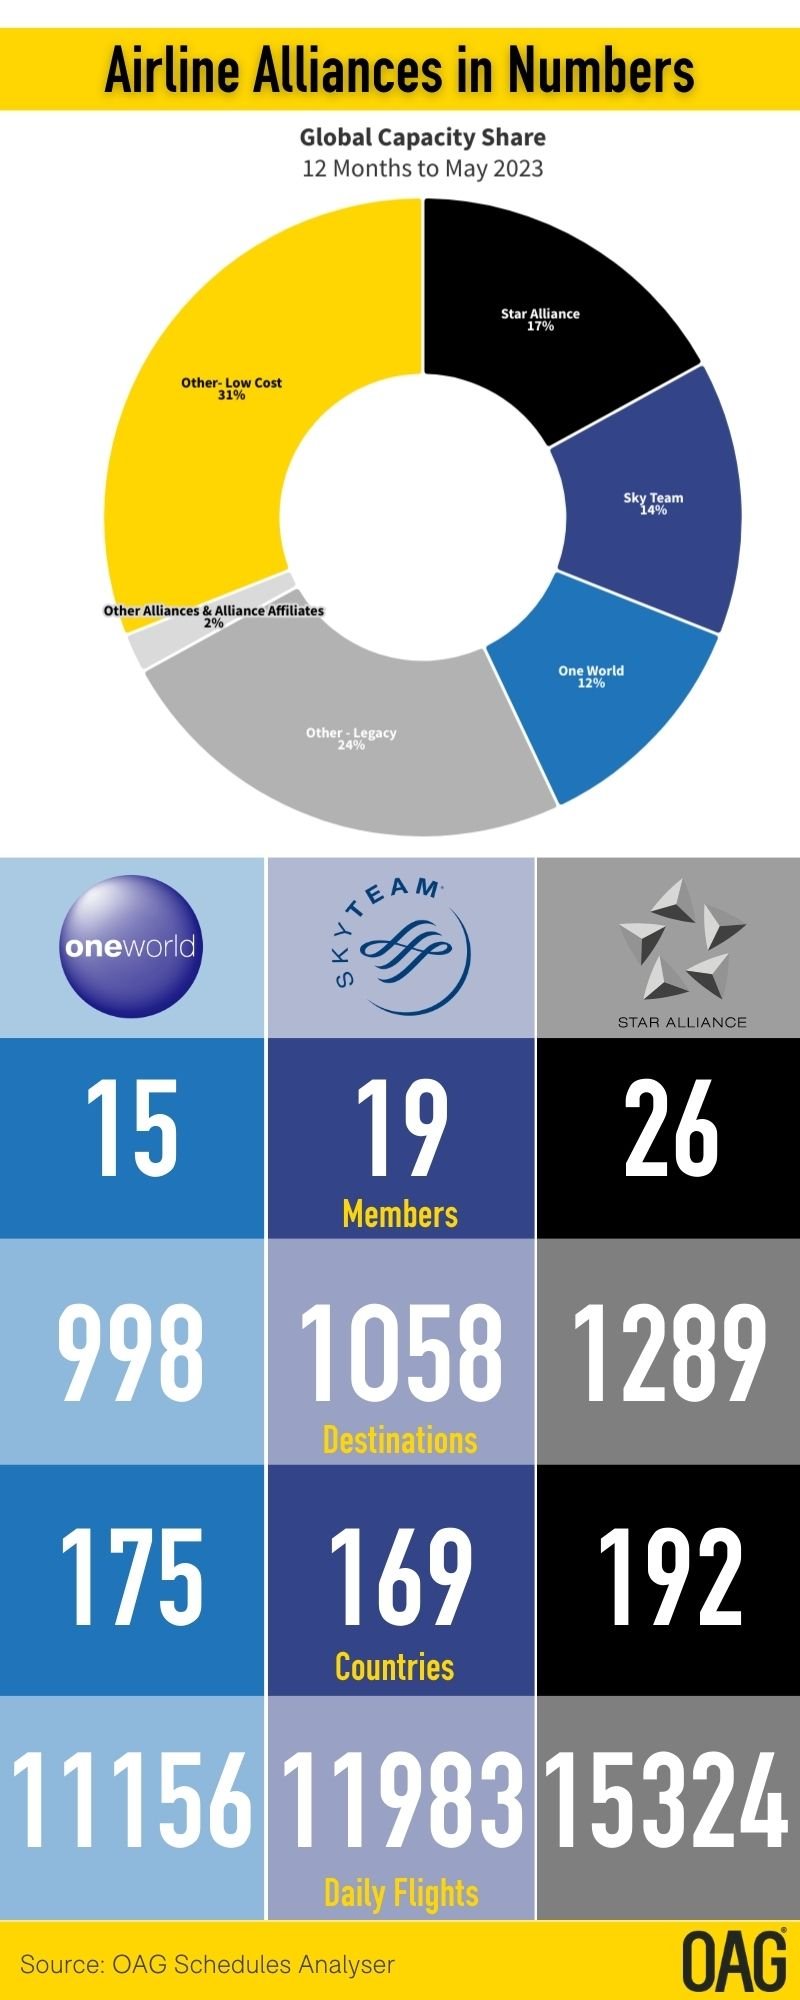
Analysis of the big three airline alliances shows that their market share continues to be eroded by LCCs - in the 12 months to May 2023, low-cost airlines not included in an alliance have operated 31% of global airline capacity, compared to 17% operated by the largest alliance, Star Alliance.
However, these legacy alliances still offer value based on the sheer number of destinations opened up to each member by the other members, as evidenced by the statistics highlighted in this infographic.
As of May 2023:
- Oneworld alliance members serve 998 destinations.
- SkyTeam airlines travel to 1058 destinations.
- Star Alliance reaches 1289 destinations.


Singapore Dominates the Top 10 International Routes in SE Asia
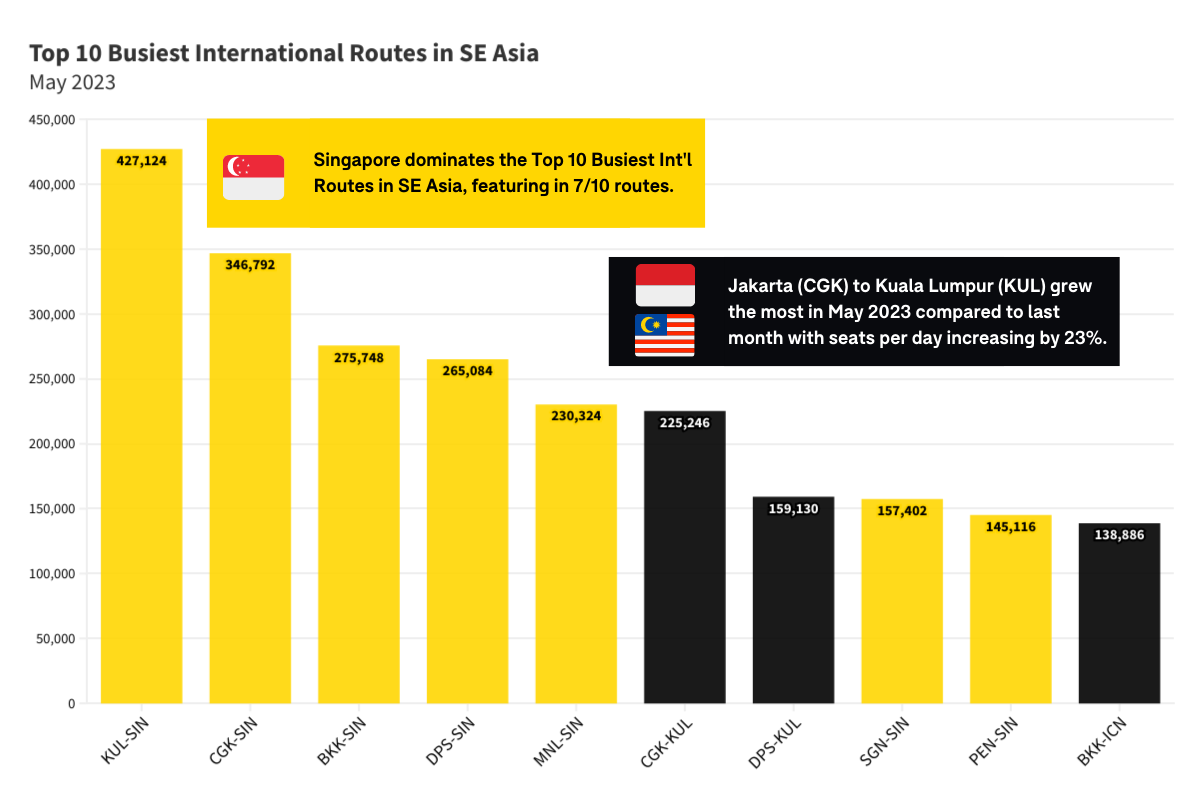
Singapore is a key location in the South East Asian market, with seven out of the top ten international routes in the region being to/from Singapore. In fact, the entire top five is made up of Singapore routes. The busiest international route in South East Asia is Kuala Lumpur - Singapore, with 427,124 seats this month.