
Seats are not the same as passengers and just because aircraft fly, doesn’t mean they are full. Whilst scheduled capacity gives a current and future view of what is happening – it doesn’t tell you what has happened and how busy those planes actually were. Passenger booking data (how many travelled) and load factors (expressed as a percentage of the seats which had passengers sat in them) do that and provide a benchmark, a view that can be used for future trends and forward-looking indicators across many sectors.
As we approach 2022, context and comparison are critical to help us all navigate our way to a pattern of recovery and growth. Last summer’s passenger booking data and load factors (July/August) provide key comparison points to track progress, and comparison with 2019 (July /August) gives context to the how demand developed as many travel restrictions relaxed and markets reopened.
Taking a selection of the world’s busiest airline routes, eleven in total, five domestic and six international, we look at what actually happened, what that tells us about emerging trends and how these routes moved up and down global rankings in terms of size.
Domestic Resilience
1) Jeju -Seoul Gimpo
In the summer of 2019 CJU-GMP was the largest domestic airline route in the world, as measured by airline scheduled capacity. This summer, the route retained its Number 1 position, benefitting from its popularity as a leisure route that wasn’t subject to the same sort of travel restrictions applied to international routes. Proving that not every airline route suffered due to the pandemic, traffic on this route was actually 4% higher in July and August 2021 than in July and August 2019.
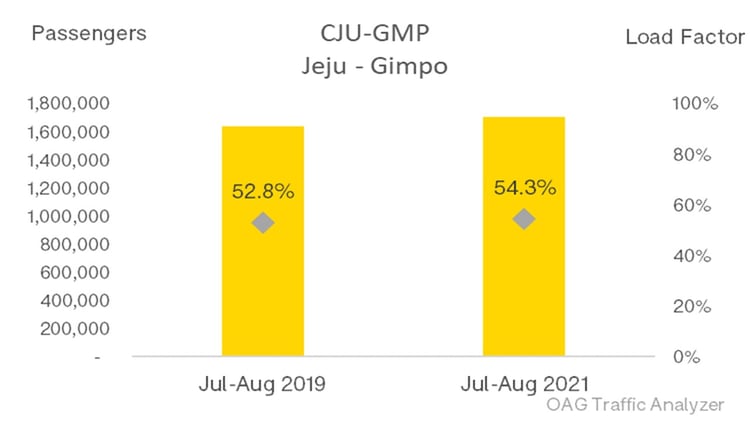
Source: OAG
2) Cancun - Mexico City
On the other side of the planet, CUN-MEX was another domestic airline route that saw an increase in airline passengers this summer, up 7% from two years earlier. The load factor was only slighter lower than in the summer of 2019, but the route moved up domestic capacity rankings from 19th biggest in the world to 7th.
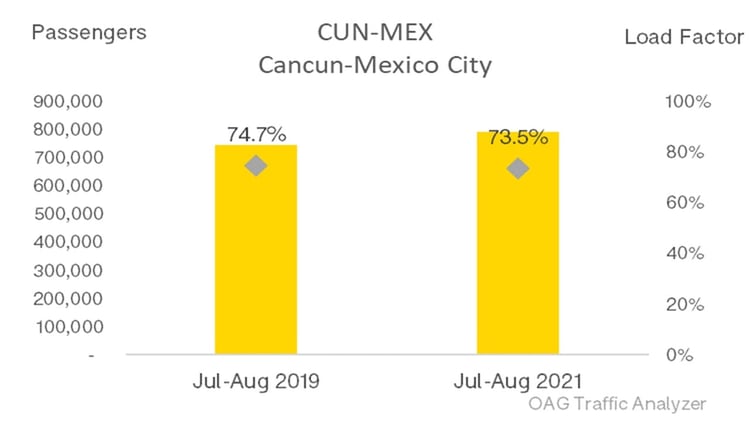
Source: OAG
3) Jeddah - Riyadh
Another major domestic market, Saudi Arabia, also saw its largest domestic route rise up global rankings in the summer. JED-RUH went from being ranked 9th amongst all domestic routes in July and August 2019 to being ranked 6th. Passenger volumes were down by 15% but capacity was down by more at -20%. All this means that aircraft flying the route achieved higher load factors in the summer of 2021 than the summer of 2019.
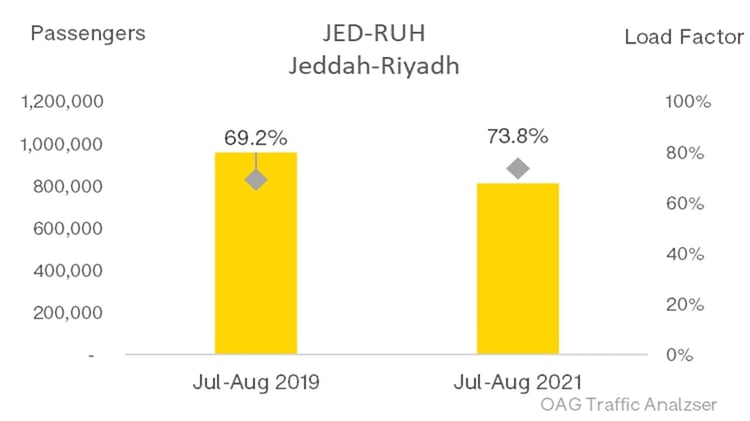
Source: OAG

Challenges for Domestic Routes
Unfortunately, as many airlines and airports will know, having a large domestic market to rely on may have provided some degree of resilience through aviation’s most turbulent times. But that has not necessarily been enough to protect routes from serious disruption and reductions in traffic.
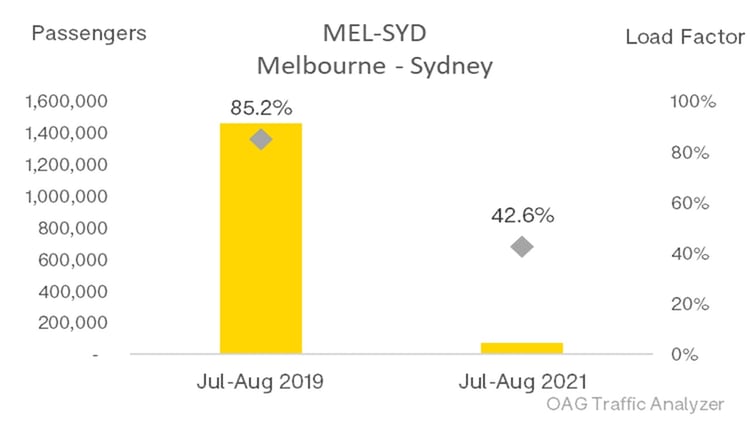
4) Melbourne - Sydney
MEL - SYD was the 4th largest domestic route in the world prior to the pandemic but in July and August 2021 its ranking fell to 523rd in the world on the back of domestic travel restrictions. The impact on this route has been immense with traffic only 5% of what it was two years earlier and load factors half what they had been.
Source: OAG
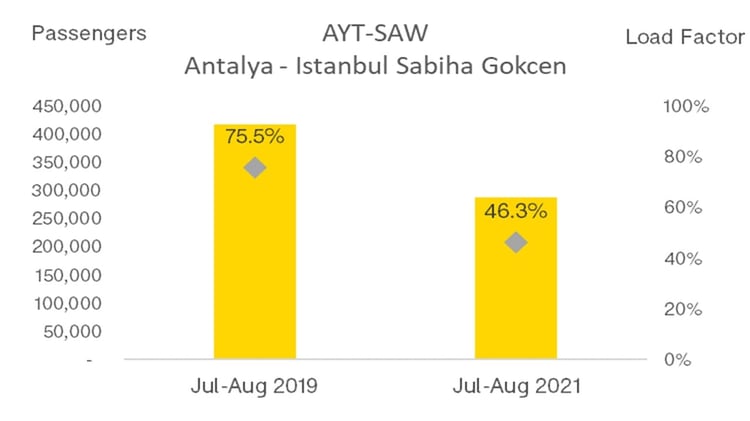
5) Antalya - Instanbul Sabiha Gokcen
AYT-SAW in Turkey was another major domestic route where traffic fell to around half what it had been, and load factors declined by almost as much. In a sign of how much domestic traffic was affected, though, a 31% fall in traffic on this route still translated into the route rising up the rankings from 63rd largest by capacity in July/August 2019 to 19th in the summer of 2021.
Source: OAG
International Movements
When it comes to international routes, the selection shown here demonstrates just how much shift there has been.
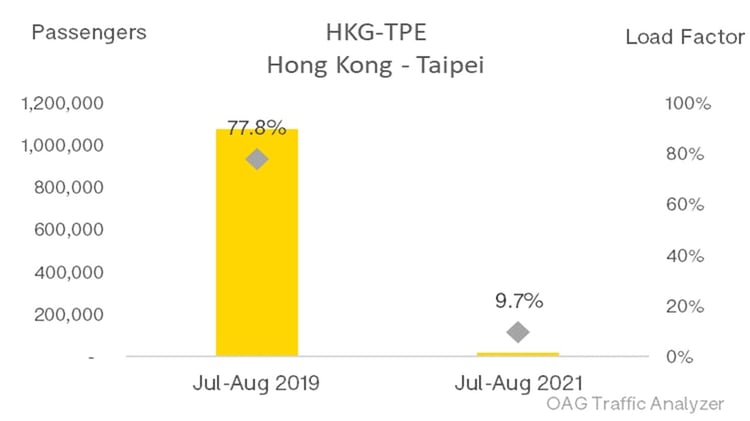
6) Hong Kong - Taipei
While HKG-TPE was ranked Number 1 among international routes by capacity in July/August 2019, it fell to 38th place this summer. That only tells part of the story, though, as passenger volumes fell by 98% and load factors on the route were less than 10% through the summer months.
Source: OAG
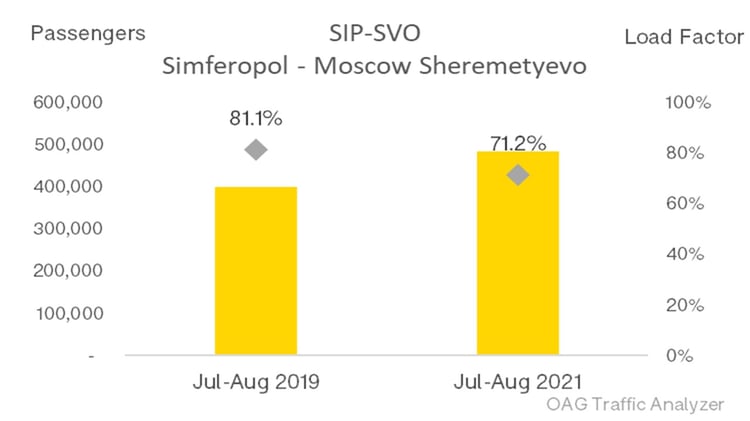
7) Simferopol - Moscow Sheremetyevo
In contrast, SIP-SVO went from 23rd place to 1st place, becoming the largest international route this summer in terms of capacity. Passenger volumes rose by 21% as Russians and Ukrainians travelled back and forth while other international routes were off limits.
Source: OAG
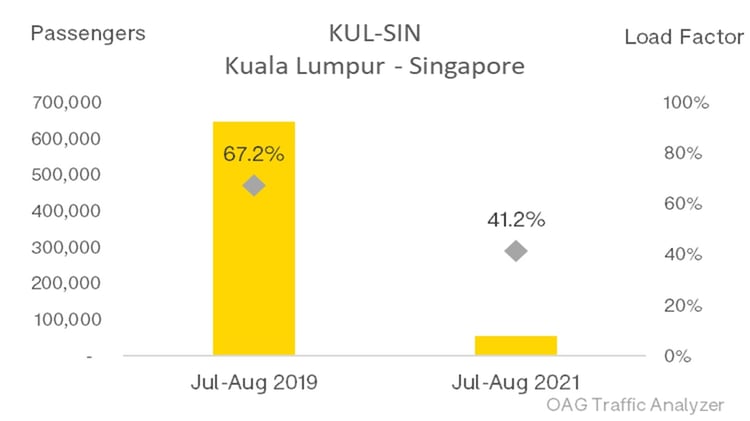
8) Kuala Lumpur - Singapore
The second largest international route for capacity was KUL-SIN before the pandemic but, like HKG-TPE, passenger volumes have been decimated. In July and August 2021 capacity was down by 86% but we can now see that passenger volumes were down by more, at 92% below the same months in 2019.
Source: OAG
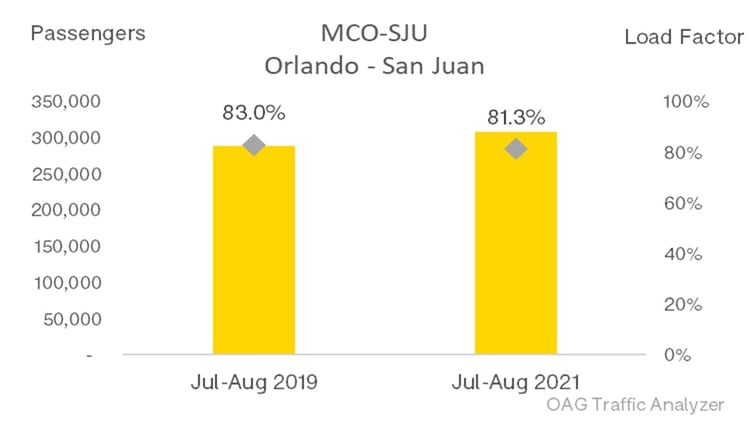
9) Orlando - San Juan
The opposite is true of MCO-SJU, where passenger volumes were only 9% below where they were in the summer of 2019 and load factors remained fairly unchanged at 81%. Clearly there are some short-haul international leisure routes where, when travel rules allow, demand can bounce back quickly.
Source: OAG
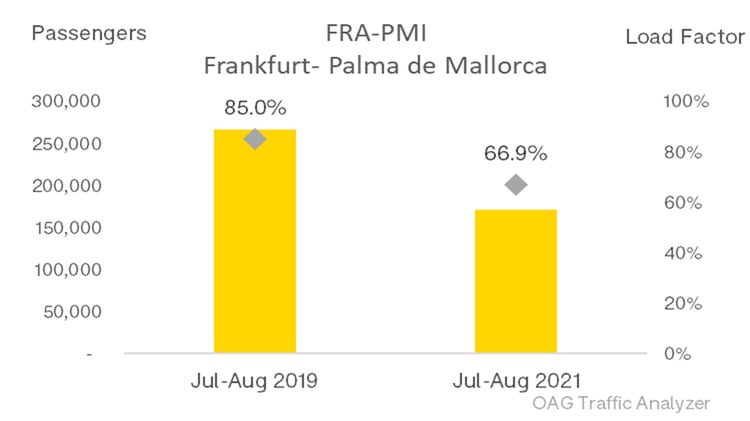
10) Frankfurt - Palma de Mallorca
FRA-PMI was the largest international route within Western Europe this summer, but while it moved from 85th to 14th in the world for international capacity, passenger volumes fell 36% compared to the summer of 2019 and the peak summer load factor was 18 percentage points off the summer 2019 load factor of 85%.
Source: OAG
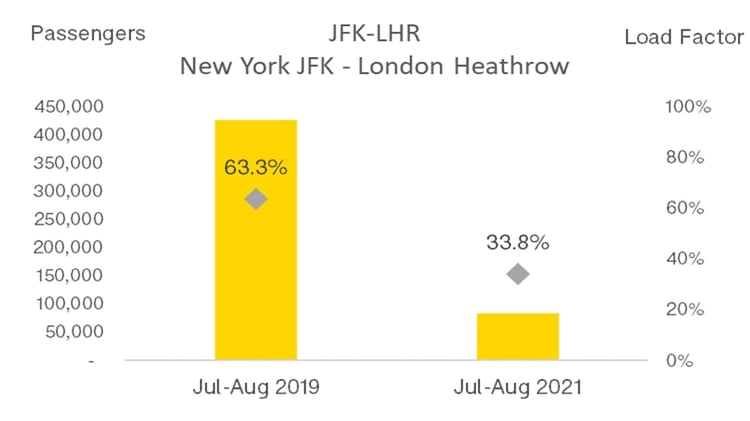
11) New York JFK - London Heathrow
JFK-LHR, formerly the largest and richest transatlantic route, saw passenger volumes at just 20% of what they were in July and August 2019 and load factors decline from 63% to 34%.
Source: OAG
The traffic data shown here relates to July and August 2021. Capacity clearly tells only part of the story. Where schedules were maintained, there was usually traffic to win. Where airlines opted to scale back schedules, it was a reaction to reduced demand, and where schedules were reduced by the most it was usually because there was limited demand and so, even then, flights operated with most seats empty.
It is clear how damaging travel restrictions have been for both airline operations and consumer demand. While mostly the impact was felt on international markets, some domestic travel restrictions had a massive impact.
As we moved into September and October, many air travel markets had a new sense of optimism as travel restrictions came under review and were relaxed, vaccination rollouts afforded more protection against the virus, and traveller confidence returned.
Now, as we look ahead, with the omicron variant starting to dominate coronavirus case numbers, and a new wave of reactions and restrictions being imposed, what lessons have been learned? Seeing the demand for leisure travel by Koreans, evidenced by the strong Jeju - Seoul market, could other destinations in the region – perhaps Okinawa – have reacted differently and put measures in place to welcome Koreans and win a share of this market? Will Australian States think twice before imposing domestic travel restrictions this time around? What we do know is that the challenges for airlines of matching capacity to supply are not going away any time soon.
|
OAG SUMMARY OF ROUTE DATA |
|||
|
ROUTE |
Jul-Aug 2019 |
Jul-Aug 2021 |
|
|
DOMESTIC ROUTES |
|||
|
AYT-SAW |
Passengers |
416,847 |
287,695 |
|
Load Factor |
75.5% |
46.3% |
|
|
Capacity Rank |
63 |
19 |
|
|
CJU-GMP |
Passengers |
1,639,940 |
1,705,115 |
|
Load Factor |
52.8% |
54.3% |
|
|
Capacity Rank |
1 |
1 |
|
|
CUN-MEX |
Passengers |
742,598 |
791,979 |
|
Load Factor |
74.7% |
73.5% |
|
|
Capacity Rank |
19 |
7 |
|
|
JED-RUH |
Passengers |
958,178 |
812,338 |
|
Load Factor |
69.2% |
73.8% |
|
|
Capacity Rank |
9 |
6 |
|
|
MEL-SYD |
Passengers |
1,462,585 |
75,272 |
|
Load Factor |
85.2% |
42.6% |
|
|
Capacity Rank |
4 |
523 |
|
|
INTERNATIONAL ROUTES |
|||
|
FRA-PMI |
Passengers |
266,318 |
171,319 |
|
Load Factor |
85.0% |
66.9% |
|
|
Capacity Rank |
85 |
14 |
|
|
HKG-TPE |
Passengers |
1,076,715 |
19,676 |
|
Load Factor |
77.8% |
9.7% |
|
|
Capacity Rank |
1 |
38 |
|
|
JFK-LHR |
Passengers |
424,599 |
83,132 |
|
Load Factor |
63.3% |
33.8% |
|
|
Capacity Rank |
8 |
18 |
|
|
KUL-SIN |
Passengers |
645,321 |
54,651 |
|
Load Factor |
67.2% |
41.2% |
|
|
Capacity Rank |
2 |
120 |
|
|
MCO-SJU |
Passengers |
288,121 |
308,332 |
|
Load Factor |
83.0% |
81.3% |
|
|
Capacity Rank |
65 |
5 |
|
|
SIP-SVO |
Passengers |
397,727 |
481,695 |
|
Load Factor |
81.1% |
71.2% |
|
|
Capacity Rank |
23 |
1 |
|
Source OAG Traffic Analyzer
Source: OAG
Recommended: