
“Just” two and a half million fewer scheduled seats this week compared to the previous week represents a 7% reduction and one of the slowest rates of decline mid-March perhaps indicating that we are now close to the bottom of capacity We have however now “broken” through the 30 million mark and are down at 29.8 million seats a week and with some expected cuts to still be filed by some major carriers we can expect that to fall further next week; perhaps below 29 million. In fourteen week; nearly three-quarters of global capacity has been cut; a scenario no one could ever have planned for.
Chart 1 – Scheduled Airline Capacity by Week Compared to Schedules Filed on 20th January 2020
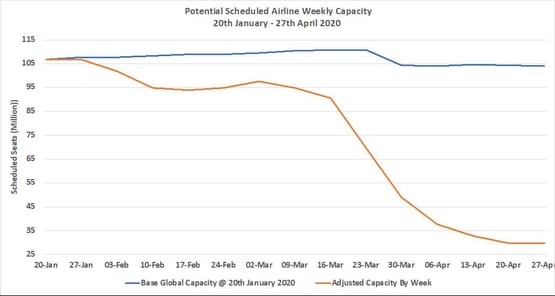
Source: OAG Schedules Analyser
In recent weeks we have seen some of the largest regional markets see reductions of up to 90% in scheduled capacity with some markets seeing most of that capacity fall in the space of two weeks during the first half of April. Supported by strong domestic capacity, although not demand, markets such as Japan, the United States, Indonesia and Saudi Arabia continue to show much smaller rates of decline than the rest of the world.
In Japan, domestic capacity has been running at some 65% of the original January levels but recent announcements from both Japan Airlines and ANA of scheduled cuts last week will filter through to the OAG database for next week. Whilst in the United States nearly eleven million seats (60%) of domestic capacity has been cut; although with seven million seats still operating this week there is plenty of capacity, if not demand.
Table 1 – Scheduled Airline Capacity by Region, 20th Jan – 26th Apr 2020 by Region
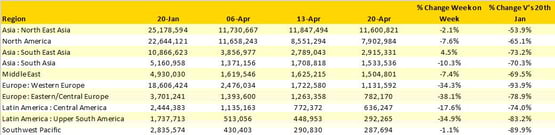
Source: OAG Schedules Analyser
It seemed a bit of a no-brainer to us that domestic capacity would always be stronger than international given the physical distances and lack of alternate travel modes available in some very large markets; it’s nice to see others now recognising that pattern. Nearly nine in every ten seats scheduled this week will be on domestic flights compared to six in ten at the beginning of the event. Looking forward to the recovery phase, the implications for those markets that have a heavy reliance on international tourism as part of their economy; it is going to take them much longer to see any significant increase in both capacity and demand.
Chart 2 – Domestic & International Capacity Splits, All Markets
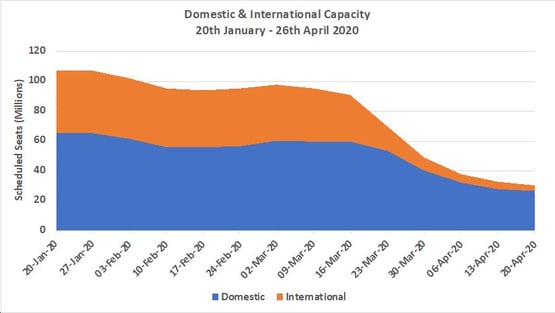
Source: OAG Schedules Analyser
Perhaps another factor related to the apparent strength of domestic markets is the high levels of cancellations that we are seeing in these markets at the moment. The chart below highlights how airlines are now more likely to cancel domestic scheduled services in the United States; on the 5th March some 47% of all planned flights were cancelled and 34% on the 18th April. Whilst in Japan the rate of domestic cancellations in the last week increased to one in four (25%) of flights being cancelled compared to 7% in the first week of April as domestic demand appears to have fallen away.
Chart 3 – US Scheduled Domestic Capacity and Cancellations, 1st April – 18th April 2020
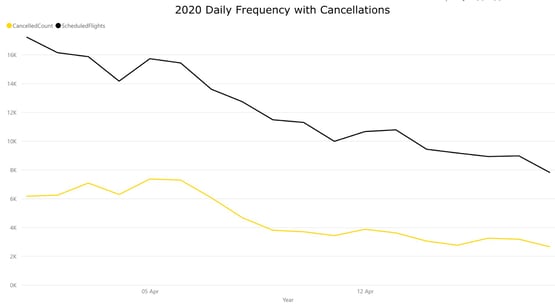
Source: OAG Schedules Analyser
The top ten scheduled airlines continue to be dominated by the US and Chinese major carriers with Southwest the largest airline in the world although operating 25% fewer seats than in January. The inclusion of Lion Air and an apparent increase in their capacity will be adjusted next week as a new filing is expected that should bring their capacity back closer to the numbers reported last week.
Table 2 - Top Ten Scheduled Airlines, 20th Jan – 26th April 2020
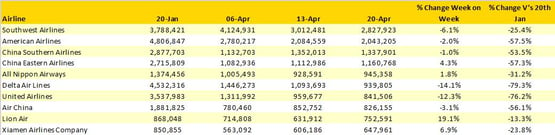
Source: OAG Schedules Analyser
In summary, falling through the 30 million capacity mark both highlights how damaging Covid-19 is to the airline industry but may at the same time represent close to the bottoming out of the capacity crisis. Quite frankly, there isn’t much more international capacity that can be dropped around the globe; to have gone from an average of 5.9 million seats, to half a million seats a week says it all. It also highlights just how crucial aviation is to international trade and economic activity.
Looking forward, quite a few airlines have scheduled capacity to be added back in from around the middle of May and we will have a look at some of that data in the coming weeks as identify more of the green shoots of recovery that will be coming along. But as always; only time will tell.