
Every week for the last two years we have been providing a weekly update on the impact of Covid-19 on scheduled airline capacity around the world. Throughout that time, providing the air travel ecosystem with essential data has had many ups and downs, twists and turns.
This week is no exception as airlines remain spooked by the latest wave of Covid-19 and have once again been cutting capacity with another 18 million seats removed from sale through to the end of March, resulting in over 51 million seats being 'lost' from the first quarter of this year. That sounds like a lot of seats, and it is, but in context - this week’s cuts were only another 1.2% of the planned capacity for the first quarter, so it could have been a lot worse!
However, there are some signs of hope in this week’s numbers, and even more hope as we peek forward into the second quarter of the year, with slightly more capacity added back for April. Are these the first signs of another recovery?
Chart 1 - Weekly Capacity Changes by Region, Forward Quarter
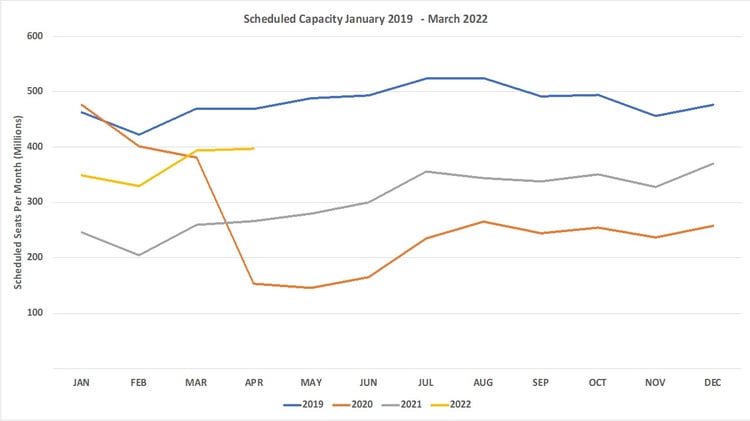
Source: OAG Flight Data (including Historical Flight Data)
As the end of January draws nearer, we appear to be getting ever closer to the bottom of Omicron’s impact, with global capacity slipping by just over half a million seats. Compared to last week, we now are now standing at 75.7 million scheduled airline seats a week. A reduction of less than 1% week-on-week suggests that most airlines have made their intended capacity cuts in response to Omicron, although of course we can never be certain. We remain at airline capacity levels 30% below this week in 2020 and at a regional level, performances are mixed; in Central America and West Africa, capacity is within 10% of 2020 levels, whilst in The Southwest Pacific, North Africa and Western Europe available capacity remains more than 40%, with South East Asia continuing to struggle to break the 50% point of recovery. As we have said so many times, each market is having its own Covid event and recovering, or not, at different paces; New Zealand has announced another lockdown, Japan faces more outbreaks and in Hong Kong, more restrictions are being imposed.
Small changes in airline capacity at regional levels can, over time, lead to changes in global rankings. North East Asia is once again creeping back to within striking distance of the current largest regional market in the world, North America, and could in the next few weeks take back its number one spot; perhaps just in time for the Winter Olympics in Beijing, although it’s doubtful anyone will be watching that event! After four weeks of consistent capacity cuts Western Europe does at least look like it has stabilised with less than 100,000 seats fewer than last week, and with the half-term holidays beginning in two weeks’ time for some countries, we may have reached the bottom of this ski slope.
Table 1 – Scheduled Airline Capacity by Region
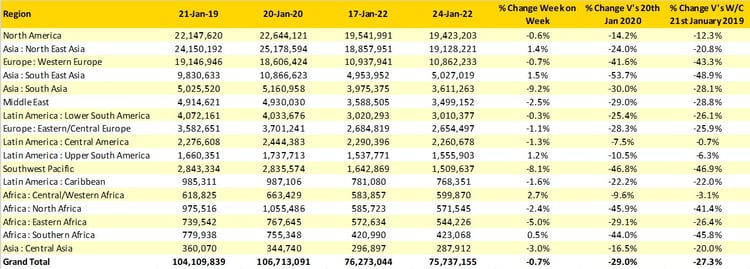
Source: OAG
India continues to see significant capacity cuts week-on-week, another 356,000 fewer seats on sale this week with all major airlines cutting capacity in some way or other. These capacity cuts may continue for a few more weeks, but as we have seen before, the Indian market recovers very quickly and by the end of February could be back at over 3.5 million seats; it really is a fast-changing market. Another market that moves quickly is Vietnam, this week's airline capacity continues to grow back with a 17% increase on the previous week allowing the country to move three places higher in the list overtaking the UAE, Saudi Arabia and Canada.
Recommended:
Australia is another market where further capacity cuts have been made week-on-week, a near 12% reduction is all based around domestic airline capacity with all the major carriers in the market. Jetstar has cut capacity by 17%, Qantas by 16% and Virgin Australia by slightly less at 9%. A reader of last week’s blog in Australia pointed out that whilst shortages of crew are an issue; demand has also been impacted by Omicron, with plenty of last-minute cancellations. Managing and operating a schedule against such a backdrop must be both challenging and frustrating for those network planners who still have any hair left!
Table 2 - Scheduled Capacity, Top 20 Country Markets
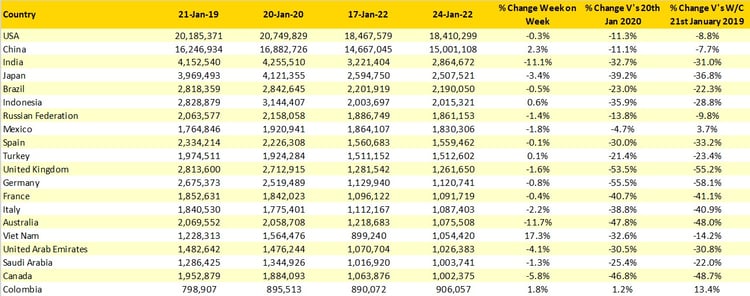
Source: OAG
Naturally, much of the weekly focus falls on the top twenty country markets, but occasionally it is worth reflecting on those once large markets where, at least in percentage terms, a recovery is still a long way from happening. Taking a criterion of at least half a million scheduled seats per week two years ago, we have tracked the twenty markets still struggling to recover. The six slowest recoveries are all in South East Asia, with Hong Kong now at just 17% of its 2020 capacity levels, whilst both Singapore and Chinese Taipei are at less than 30% of normal production levels. The 'top' three countries are of course all dependant on international capacity and specifically to China, Australia and New Zealand, which makes any noticeable improvement very unlikely in the first half of this year given how things stand now.
Table 3- Poorest Twenty Markets to Recovery, Greater than 500,000 Seats Per Week
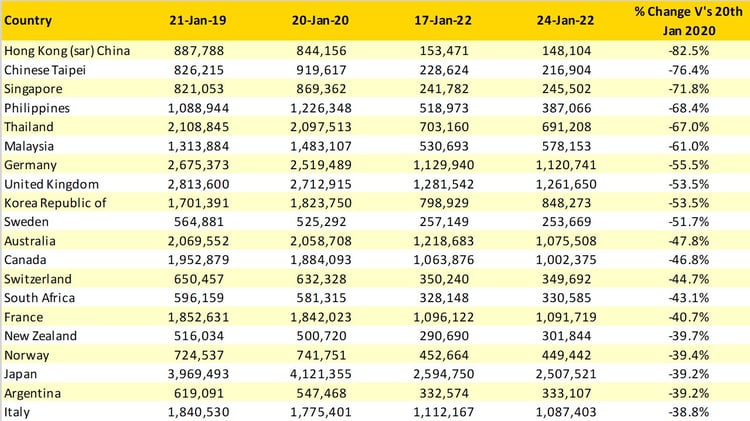
Source: OAG
This week, rather than tell you that American Airlines are the largest airline in the world and that Southwest Airlines have added back around 6% more capacity week-on-week, we thought we would look at the top and bottom ten in terms of week-on-week capacity growth, with a minimum operating criteria of 200,000 seats a week.

Starting with the top ten for capacity growth then, it’s no surprise that with Vietnam one of the few country markets reporting growth, the local airlines lead the way. It is equally no surprise that the low-cost carrier, at least in percentage terms, is heading the list. Five of the ten carriers listed are based in China and planned capacity increases in that market now must be treated with some caution, as conditions can change as quickly as a lateral flow test result. So that’s the optimistic side of the equation…
Table 3 – Top 20 Scheduled Airlines
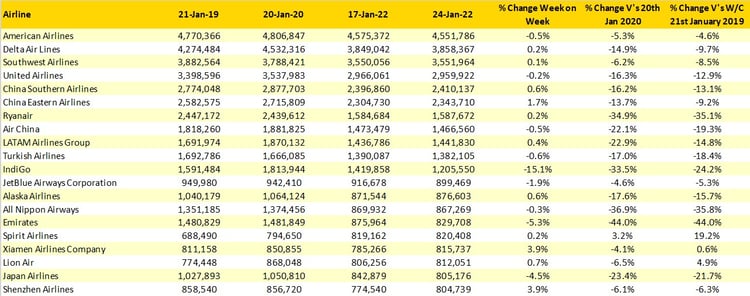
Source: OAG
Finally, for this week, the blog has reached new heights. More precisely 39,000 feet, whilst written on an Etihad flight down to Abu Dhabi. With probably no more than a 20% load factor for many travellers, it was a matter of pick your row rather than your seat! The whole travel process was certainly smoother than what I have experienced with some other carriers in recent months and the service was great, watching the Premier League on a Sunday afternoon was a result!
This week is always one of the lowest demand weeks of the year; the lack of corporate demand is also noticeable, although many 'turned left' on boarding this flight, suggesting at least a bit of decent revenue. For all of us, travel is part of what we do, it is in our DNA, so if you can start to rebuild that confidence and book a flight somewhere soon, then do it!
Stay safe everyone.