
A steady 3.5% growth in capacity takes us to just under 56 million seats this week as the slow recovery continues. The major “story” last week appears to have been the retirement of the BA B747 fleet; something that we had predicted months ago and yet somehow still manages to make headlines for an airline that really isn’t back flying yet. In January there were twelve scheduled airlines deploying the B747; that is now down to ten with Lufthansa now the largest operator; what price for more airlines dropping the aircraft in the next few months?
The solid recovery in capacity is obviously positive but concerns are continuing to grow around sustainable demand recovery in many markets. Spikes of demand once a market reopens are now as common as a second spike of Covid-19 which unfortunately seems capable of lingering longer than demand. Reports of airline load factors remaining at less than 20% are quite common; Singapore Airlines reporting a 12% load factor in June and the US TSA checkpoint data continues to hover at around 25% of last years levels.
Chart 1 – Scheduled Airline Capacity by Week Compared to Schedules Filed on 20th January 2020 & Previous Year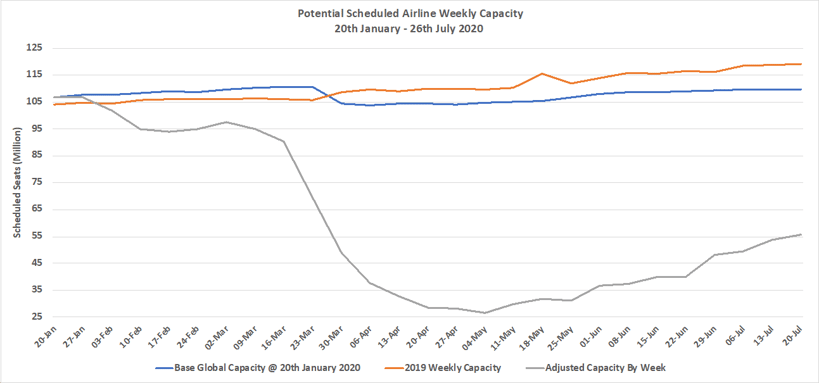
Source: OAG
Rather than focus on the top ten this week we are going to focus on some other data points that both show the impact of Covid-19 and how different markets continue to be at different stages in their recovery. Ten regional markets continue to report less than a 40% recovery in capacity compared to mid-January with both Latin America and Africa continuing to be badly impacted. In both Latin America and Africa, capacity is just 26% of that reported twenty-seven weeks ago with Upper South America (-88%) and Southern Africa (-87%) the two worst affected regions. Sometimes it is too easy to report on the positive recovery aspects from Covid-19 but there remain many markets and airlines that are still trapped and in the mist of lockdowns.
On a slightly more positive note, North-East Asia continues to lead the global recovery with an additional 1.1 million seats added to regional capacity. In Western European capacity continued to grow with another 400,000 plus seats added this week leading to a doubling of capacity in less than a month; presumably both sun and ice cream sales have also doubled in the same period.
Table 1 – Scheduled Airline Capacity by Region, 20th Jan – 26th July 2020 by Region, Ten Weakest Market Recoveries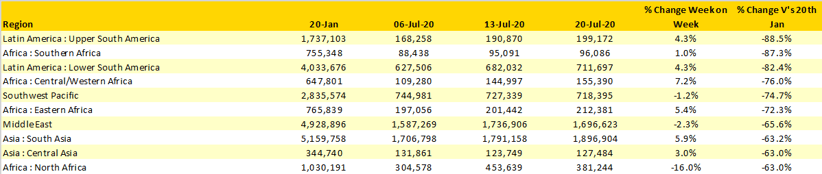
Source: OAG
The United Kingdom’s fragile tenth position last week, lasted about as long as Leeds likely return to the Premier League dropping straight back out again! France assumes tenth position as four European markets occupy tenth to fourteenth place with less than a 36,000 differential; whose turn next week Germany perhaps?
China continues to be the largest market although the reported second spike event in Xinjiang region is not reflected in the latest data; some half a million seats a week operate to and from Urumqi the regional capital and many of those have already been cancelled.
Japan has seen a significant 9% increase in capacity this week with Japan Air Lines adding back some 140,000 additional seats although that still places them with just over half the capacity of All Nippon Airways. Virtually all of that new capacity is in the domestic market with some 50,000 extra seats at Tokyo Haneda; it will be interesting to track cancellation rates in the next few weeks as that new capacity settles back into a market that has experienced abnormally high rates of cancellation in recent months.
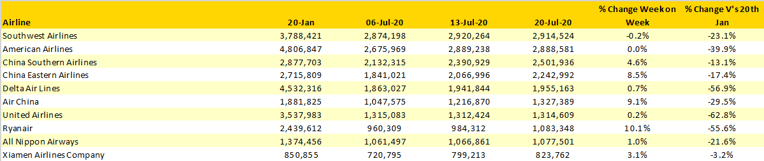
Table 2- Scheduled Capacity, Top 10 Country Markets
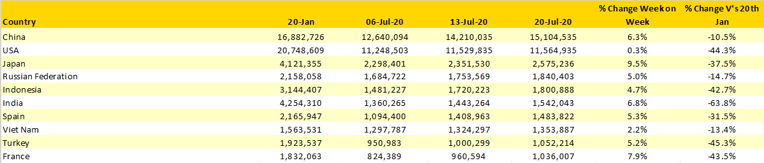
Source: OAG
Another eight airlines recommenced scheduled services this week taking the current count to 634 compared to 709 in January whilst a number of airline increased capacity this week. Amongst those adding more capacity are easyJet (+53%), Air India (+29%) and British Airways (+21%) although both BA and AI are still operating less than 25% of their normal weekly capacity. The top seven airlines have remained constant throughout the Covid-19 event and while Ryanair have added back over one million seats in less than a month it would take a massive increase in capacity to edge closer to seventh position in the coming weeks.
Table 3- Scheduled Capacity, Top 10 Airlines
Source: OAG
Domestic capacity continues to grow at twice the rate of international and now accounts for over three-quarters of all capacity compared to 61% in January, in many ways highlighting both the dramatic impact of lockdowns on international demand but also perhaps consumer confidence to travel overseas having been shattered. Only time will rebuild that confidence.
Table 4 – International & Domestic Capacity

Source: OAG
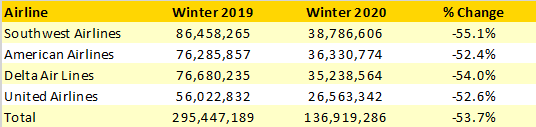
Looking further forward at current planned capacity amongst the major US domiciled airlines reveals a quite scary set of numbers with all four airlines currently only planning to operate around half of their normal winter capacity suggesting that we should not be expecting too much more of a market recovery in the coming months. If that pattern was replicated across other markets, then we should expect to see more capacity coming out rather than being added in the next few months.
Table 5 – Current Scheduled US Airline Capacity Winter 2019 V’s Winter 2020
Source: OAG
Next week should have been the peak summer season week for capacity as all the major markets will have started their school holidays, current scheduled capacity for next week stands at 60.6 million which allowing for some capacity fall out will probably edge down closer to 59 million based on current patterns. Fingers crossed that we do stay just above that 60 million mark!