

Global capacity continues to creep forward was this week’s planned headline; then the UK Government stepped into to change that; thanks Boris! The blanket quarantine restriction for travellers from Spain despite most of the country recording lower Covid-19 levels than the UK will be the final nail in the coffin for some tour operators over this winter.
Before Saturday’s news global numbers were continuing their steady climb away from the dark days of May. At 57.5 million weekly seats we are at some 48% of last year’s capacity which from recent industry assessments is likely to be around where we will remain for the remainder of the year unless some dramatic development occurs. Passenger demand continues to be much weaker with traveller confidence drained by spikes of Covid-19 activity in both Asia and Europe.
.
Chart 1 – Scheduled Airline Capacity by Week Compared to Schedules Filed on 20th January 2020 & Previous Year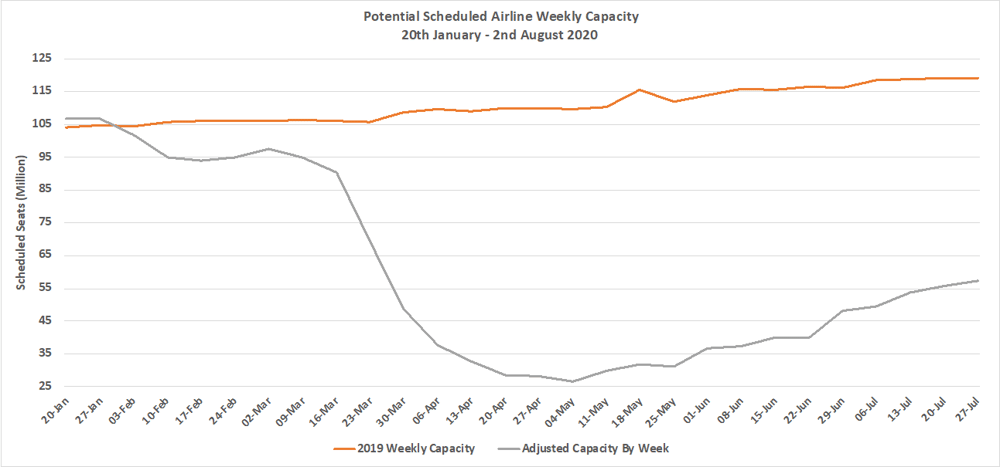
Source: OAG
Throughout our tracking of capacity, we have frequently commented on the faster recovery in short-haul capacity but have not looked in detail at the impact on long-haul capacity; we have now, and the numbers are stark. Taking 3,000 nautical miles as a cut-off point then at the moment only 16% of capacity will be operating this week compared to last year and as we discussed in the last OAG Live webinar many low-cost long-haul airlines remain grounded; perhaps for ever given the slower than expected rate of recovery in some markets.
Chart 2 – Scheduled Airline Capacity Comparison Greater Than 3,000 Nautical Miles 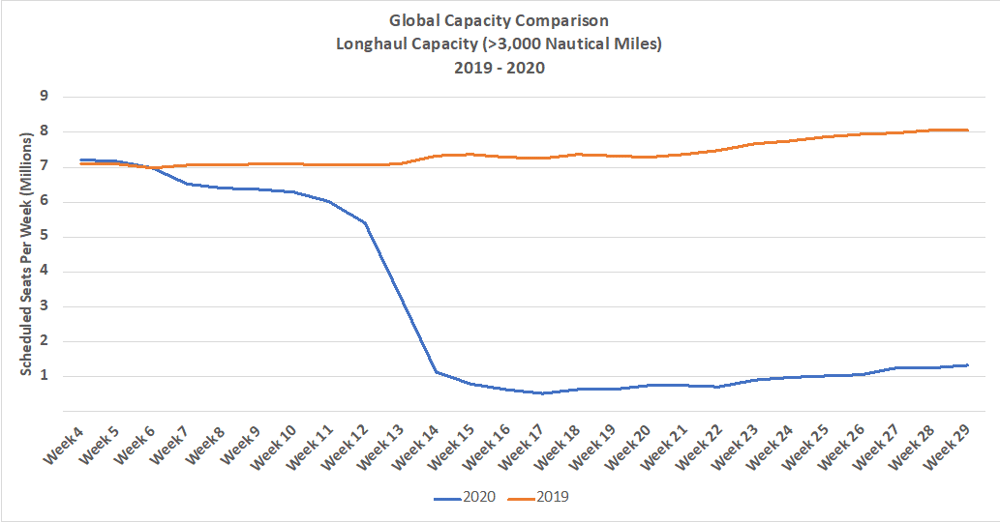
Source: OAG
Two regional markets are now close to 80% of their January capacity levels; Eastern Europe and North East Asia but as is frequently the case the two regions are recovering in very different ways. In North East Asia the strength of recovery in the three domestic markets in China, Japan and South Korea means that until international capacity relaxations occur that we have probably reached plateaued in terms of recovery. When or indeed if China reopens for international travel then that situation will change very quickly.
In Eastern/Central Europe, nearly every country market is very close to pre Covid-19 capacity levels. However, Russia’s market size and the restrictions on international capacity mean that capacity is at just one-third of normal levels; the recently announced easing of restrictions on international flights should help in the recovery process.
The capacity challenges created by Covid-19 moving at different rates in different regions is highlighted by the struggles being reported in South America with Lower South America at just 17% of January capacity levels and Upper South America at 12%. With airlines receiving little Government support in those regions the prognosis for all operators continues to deteriorate each week as lockdowns and quarantines continue to prevent nearly all travel.
Table 1 - Scheduled Airline Capacity by Region, 20th Jan – 2nd August 2020
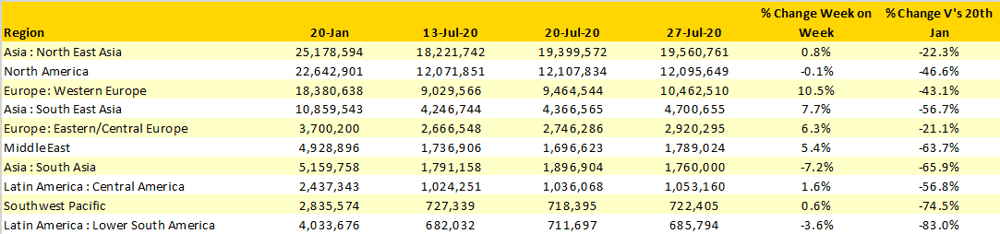
Source: OAG
Back by popular demand the UK once again entered the top ten country markets, it will probably drop back out next week to be replaced by France given that there is only a 3,000-seat differential between the two countries. Spain’s continued recovery over the last five weeks will of course also be impacted by the UK’s latest moment of aviation madness; Spain’s short-term loss may be a short-term gain for markets such as Turkey and Italy where Covid-19 levels are lower and where UK Government ministers have probably booked their holidays!
The United States weekly capacity data remains steady despite recent Covid spikes in many States and the increasing travel restrictions into the New York area from other points in the country. It’s interesting to note that travel to many Caribbean Islands is now possible albeit with some onerous arrival requirements but flights to Mexico and Canada remain very limited, US – Canada capacity is just 8% of January levels. There is a growing sense that US based airlines are already planning for some deep capacity reductions once the CARES Act support programme expires at the end of September; major US airlines are only planning around half of last year’s capacity levels for the next IATA Winter Season.
Table 2 - Scheduled Capacity, , Top 10 Countries Markets
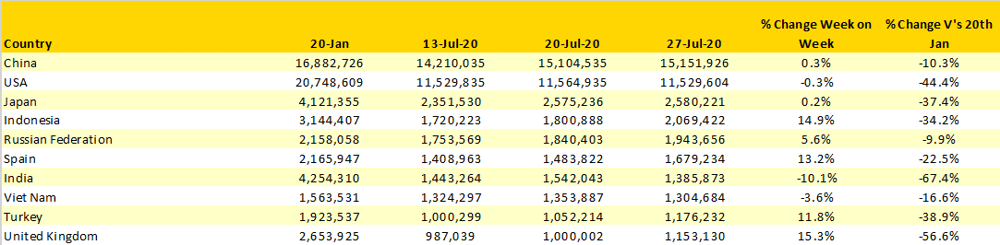
Source: OAG
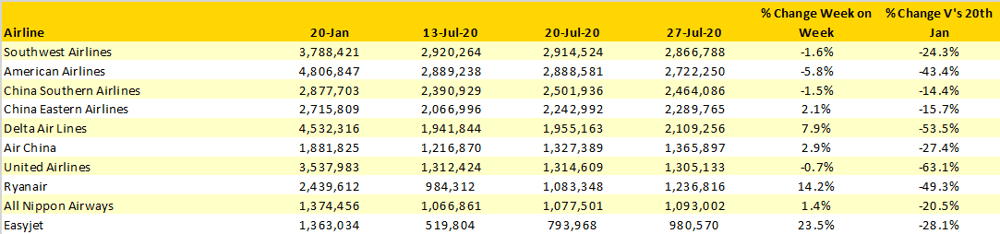
The weekly update of the top ten global airlines highlights the pace of global recovery in different markets. In Europe, Ryanair and easyjet have continued to grow back capacity at a rapid rate while in the United States many of the majors have eased back on capacity slightly as demand softens. The science of matching capacity to expected demand is now relying on guesswork, previous experience and in some cases reading tea-leaves; who would want to be a network planner in today’s new normal world?
Table 3 – Scheduled Capacity - Top 10 Airlines
Source: OAG
As this is the last week of July it seems perfect timing to take a sneak peak at August capacity. We know that airlines are making last minute schedule changes and looking forward we should expect more changes throughout August. With capacity at current 57.5 million the currently scheduled 71.3 million scheduled capacity for the last week of August will to some seem optimistic. I suspect that we will perhaps see global capacity closer to 60 million by the end of August as long as the UK Government doesn’t find somewhere else to quarantine in the next few days!