Week twenty-three of the Covid-19 crisis and the lowest week on week change in capacity reported. 39.911 million seats this week compared to 39.960 million last week represents less than one tenth of a percentage point change in capacity as airlines around the world wait for July and further clarity around lockdowns, corridors and bridges. The headline numbers may have remained constant but there remains considerable churn in the weekly data.
This time last week the OAG database was reporting some 43.5 million; in seven days airlines removed just under 8% of the planned capacity with less than seven days’ notice highlighting the levels of fluctuation around the globe. Collectively compared to last year, since the 20th January some 1.1 billion fewer seats; a 45% reduction in capacity and of course a devastating impact on airline revenues around the globe.
Chart 1 – Scheduled Airline Capacity by Week Compared to Schedules Filed on 20th January 2020 & Previous Year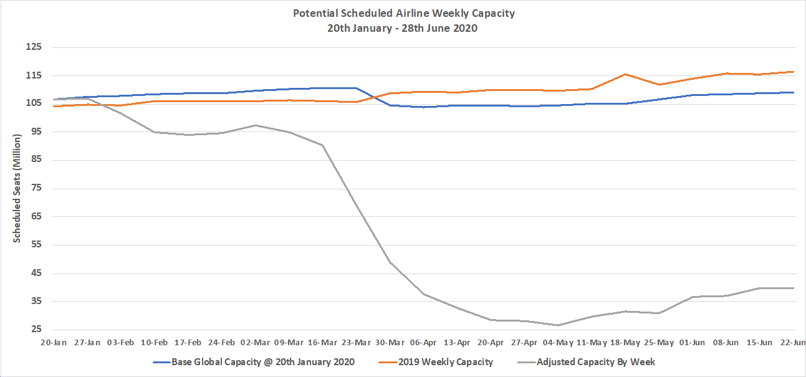
Source: OAG
Despite the relatively small changes in weekly capacity there is actually quite a bit of movement in regional capacity week on week. Asia in particular has seen a significant change in capacity, in North east Asia one million fewer seats are on offer this week, South Asia reports a 200,000 weekly reduction and South East Asia juts under 100,000 fewer seats. The combination of those capacity losses effectively neutralises the 18% increase in Western Europe and nearly 600,000 additional seats placed back into the North American market.
Looking for glimmers of hope in the regional data, only two of the top ten regional markets remain with less than 809% of their capacity as of January although in the case of Lower South America with -88% compared to the week of the 20th January there is a considerable gap before any sense of recovery begins to emerge.
Table 1 – Scheduled Airline Capacity by Region

Source: OAG
China remains the single largest country market with some 11.9 million seats this week although that does represent over one million fewer than last week and we will look at that in a bit more detail later. Continued capacity growth in the United States resulted in a 7% increase in capacity and recent data from the US TSA suggest that demand for domestic travel has been growing strongly in recent weeks which is a positive development.
Further capacity cuts in both Indonesia and India suggest that initial pent up demand for travel during lockdowns has now settled and the airlines have accordingly been adjusting capacity to meet those new demand levels. Capacity to Spain has increased by some 64% week on week with the addition of a further 213,00 seats as the country eases quarantine requirements and takes some early steps to restarting the summer tourism season; hovering in twelfth place we should expect Spain to move into the top ten country markets shortly.
Table 2- Scheduled Capacity, Top 10 Country Markets

Source: OAG
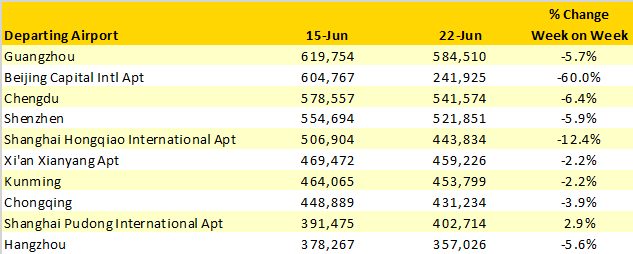
The reported spike in COVID-19 cases in Beijing last week has had an immediate and dramatic impact on capacity at the airports two main airports as the table below highlights. Beijing Capital has seen a 60% reduction in capacity with over 350,000 fewer seats operating this week while the relatively new Beijing Daxing, the 13tht largest airport in China saw a slightly larger 63% reduction in capacity with some 186,000 less seats available.
Table 3- Scheduled Capacity, Top 10 Airlines
Source: OAG
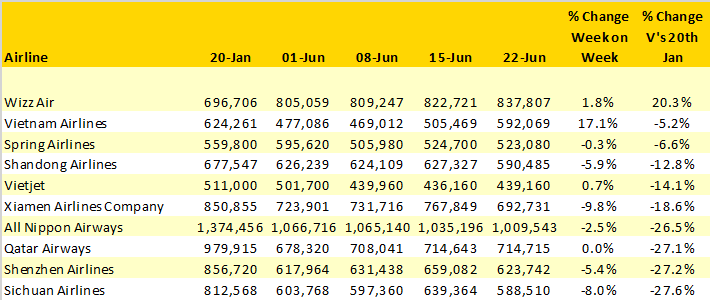
Ahead of this week’s OAG Webinars when we will look at the various recovery strategies from airlines around the world who typically operate more than half a million seats a week we have this week looked at those carriers operating capacity closest to their January levels and those still to make any significant capacity changes
Wizzair’s 20% greater capacity than in January both reflects their bullish attitude to the market recovery and also the very seasonal nature of their regular monthly operations; nevertheless, it is a remarkable approach. Eight of the “top ten” if that is the correct description are based in Asia with five based in China.
Table 4- Top 10 Ranking Airlines When Comparing Capacity To W/C 20th January 2020
Source: OAG
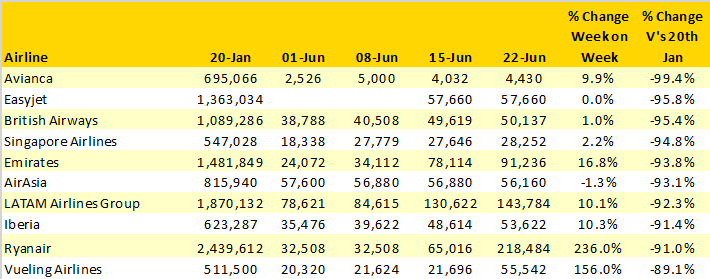
At the other end of the spectrum, of those airlines that have not either collapsed or entered some administration process EasyJet “lead” the way with less than 5% of their capacity being operated and British Airways in third place; clearly the UK’s quarantine measures are having the desired effect! Interestingly; Emirates rank fifth in the list, a very different position and strategy perhaps being adopted compared to Qatar Airways and with both carriers heavily dependent on 6th Freedom flows it begs the question which carrier has got the right strategy in place?
Table 5 - Bottom 10 Ranking Airlines When Comparing Capacity To W/C 20th January 2020
Source: OAG
A glimpse forward to next weeks data shows some 55.4 million seats still scheduled for operation which seems slightly unrealistic given current trends and market sentiment. North East Asia currently sits with some 2.6 million more seats week over week which given the current COVID-19 alert in Beijing will probably revert back to the current 15.5 million. And in Western Europe current filings suggest a 40 million seats increase week over week; there’s probably more chance of Arsenal winning than that happening!


.jpg)


.png)


