It’s a very simple equation, match supply to demand or indeed keep supply a little below demand, and all things considered that should make for a successful business - easy to say, but very hard to achieve in the airline industry. Of course, the biggest challenge is that you can’t just stop flying or furlough staff for a few weeks when demand softens and then bring those aircraft (and staff) back online at some point, however well you plan, or can you?
Every week we take a sneaky peek forward to see how capacity is shaping up by airline - partly to ensure that we have the latest schedules and to ensure that we capture all the subtle changes in capacity that some carriers make. So, for some carriers we have a good idea of when new capacity is coming online, for others we know when the seasonal peak periods are about to start, and for some when the big trade fairs are about to take place. It also allows us to identify who really does match capacity to demand and who really does know their market, and there are no better examples than Allegiant Air and Sun Country Airlines.
Flexibility Is Key
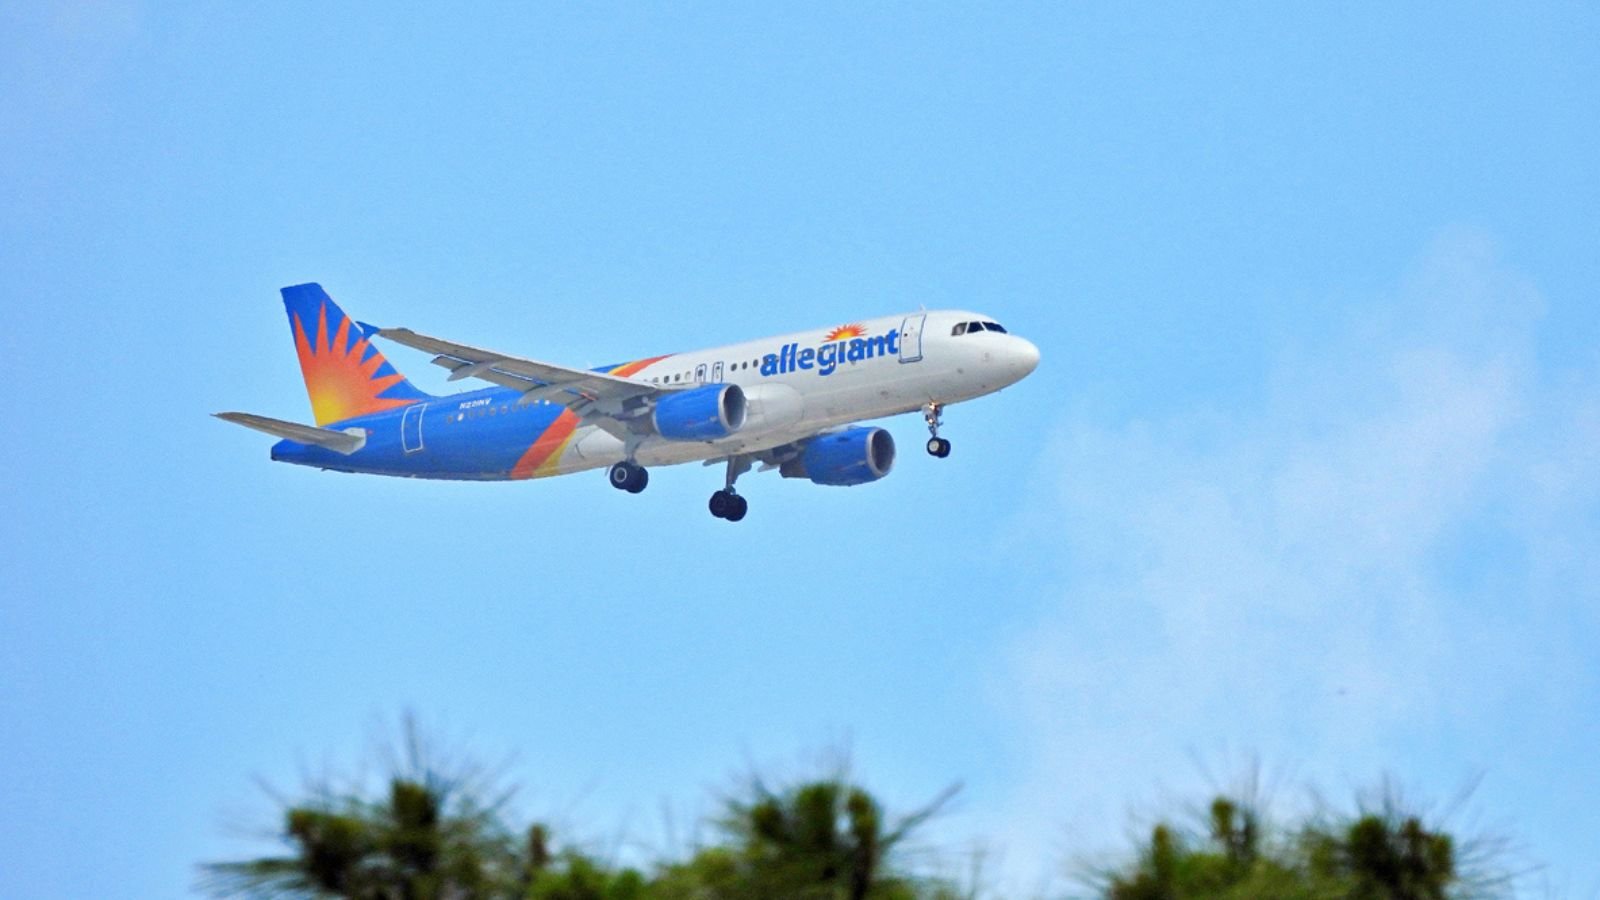
Whilst many will have heard of Allegiant Air - who operate a fleet of over 210 A320s ranking as the 62nd largest airline in the world - Sun Country are perhaps a different proposition with their 70 B737s placing them 179th global carriers list. However, they both operate a network of seasonal services that allow them to match capacity to demand - as the chart below illustrates, which compares the two airlines’ weekly capacity against some of the US legacy carriers.
Given the challenges of the capacity scale, it is not too easy to pick out the variances for Allegiant Air and Sun Country, but the important point is more to identify the quite significant reductions in capacity that legacy carriers make on domestic routes with both Delta Air Lines and American Airlines reducing capacity across the 4th July holiday period with smaller cutbacks in late May (Memorial Day) and then in early September around Labor Day in the case of Delta Air Lines.
Compare and contrast the patterns of the legacy carriers with how Allegiant Air and Sun Country operate and there are some notable differences. For example, from the second week in April Allegiant Air actually reduced capacity week-on-week through to the week of the 29th May when they added back 27% more seats than operated two weeks earlier as the summer holiday market begins, peaking production with 461,000 seats in the week of the 24th July. Indeed, the range of capacity offered by Allegiant stretches from 284,000 weekly seats in early January up to that 461,000, a 63% increase in capacity.
In capacity terms, Sun Country Airlines are around one-quarter the size of Allegiant but also display the ability to adjust capacity quickly. The airline's busiest week was the 19th June with 125,000 seats and their quietest was the 9th January with just 63,500 seats, a swing of over 100%. Both carriers clearly show their flexibility, but what is it in their networks that shapes such dramatic capacity moves?

Allegiant Air's Classic Sun Network
It is probably no great surprise when capacity flexes so much that the summer sun markets of Florida and California are major factors for Allegiant in their network structure, but there are one or two more interesting growth areas for the Nevada-based carrier. While California benefits from a near three-fold increase in capacity, Ohio (Cincinnati) and Pennsylvania - although small numbers - see some seasonal growth.
Interestingly, the Florida seasonal capacity growth excludes any presence at the States two largest airports; Orlando is served by capacity at Sanford and Miami at Fort Lauderdale/Hollywood with Punta Gorda - a remote airport on the gulf coast ranking as their 3rd largest operation, an airport where they are literally the only scheduled carrier in most weeks of the year.
Sun Country’s In and Out Network
Adopting a slightly different approach, Sun Country operate to 43 States in the peak weeks of the year, slightly more than the 41 served by Allegiant, serving 16 of those markets with less than 1,000 seats a week and fewer than three weekly flights. Whilst that strategy may at first glance look fragmented, the network is primarily driven by serving the outbound Minnesota market from Minneapolis/St Paul which accounts for 42% of the airline’s capacity in the busiest weeks, nearly six times more than the second largest market – California - as the table below highlights.
Another interesting aspect of the Sun Country network is that 17 of the States are only operated to in the peak weeks of the year, reflecting that Minnesota-centric network model. Such networks always carry an element of risk, with a high dependency on the wider economic prosperity of the State central to the carrier’s continued success, and that happily seems to be thriving at the moment. For both airlines, however, there are other flexible factors that allow them to operate the networks that we see here...
Flexibility, Flexibility & More Flexibility!
Suddenly dropping scheduled capacity only works if you can either schedule maintenance into those off-peak periods or find alternate sources of income. Sun Country, for example, are a major supplier of charter capacity to the NFL during the season, moving both teams and supporters around the country provides a regular source of revenue.
However, for both airlines, the flexibility of their crews and operational teams to work with such seasonal demand is perhaps the most important and significant factor. For some staff that seasonal profile may perfectly align with their personal working requirements, but it does mean that when it’s busy it’s incredibly busy, and when it’s quiet it’s time to catch up with Netflix!
- Join us at the next Live Webinar on 13 September - Register for Updates 🔔
- A Productive Q2 2023 For The Airline Industry: Interpreting The Data - Read Now