
OAG's data provides up-to-the-minute insight into diverse areas of the aviation and wider travel industries. This month, we've been able to give an overview of China's top airlines, identify the types of aircraft most frequently used worldwide and highlight the US states adding most airline capacity, to name just a few examples.
Scroll through the infographic slides below and click an image to access full data and in-depth expert analysis.
China Southern and China Eastern Provide Significantly More Capacity
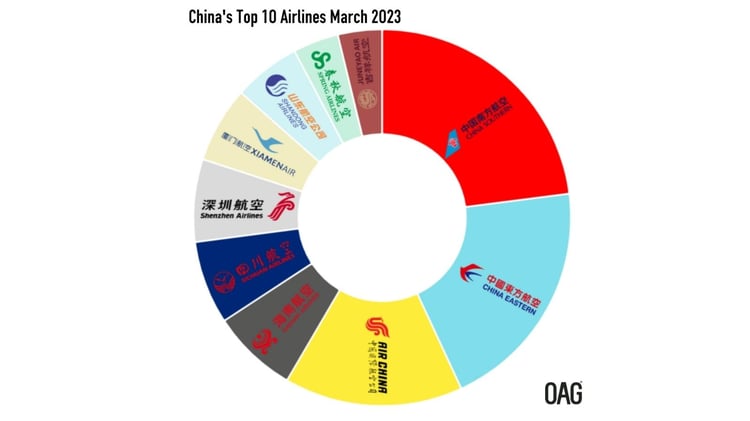
China Southern and China Eastern provide notably more capacity than the next tier of carriers.
- China Southern provides almost 1.5m more than China Eastern
- China Eastern provides 2.5m more capacity than the next largest carrier Air China

6% More Airline Capacity Added in Florida
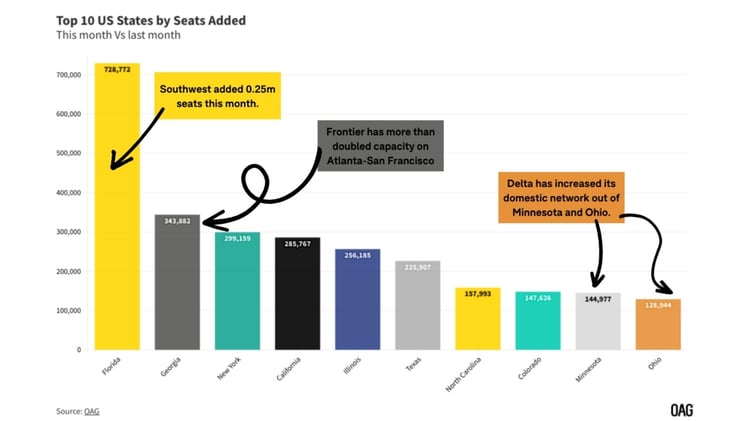
US carriers are adding 6% more capacity in Florida this month (when we adjust for underlying variance in the day of the month between Feb and Mar) - driven mostly by the US majors, with Southwest alone adding almost 0.25m airline seats month-on-month.

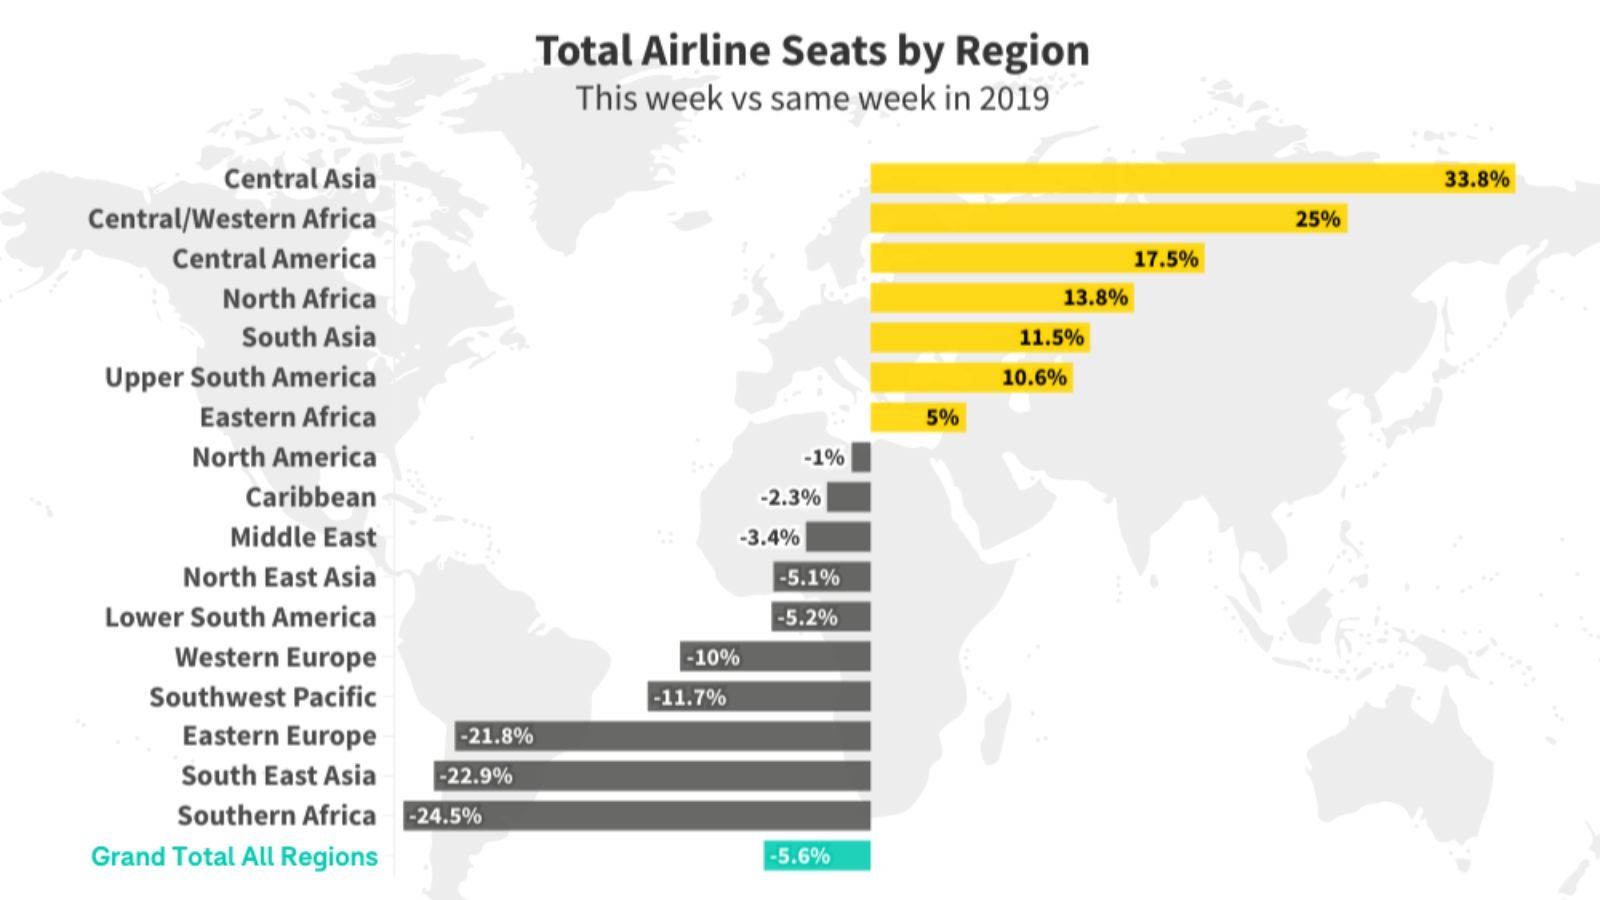
7 IATA Regions Operating Capacity Exceeding 2019 Levels
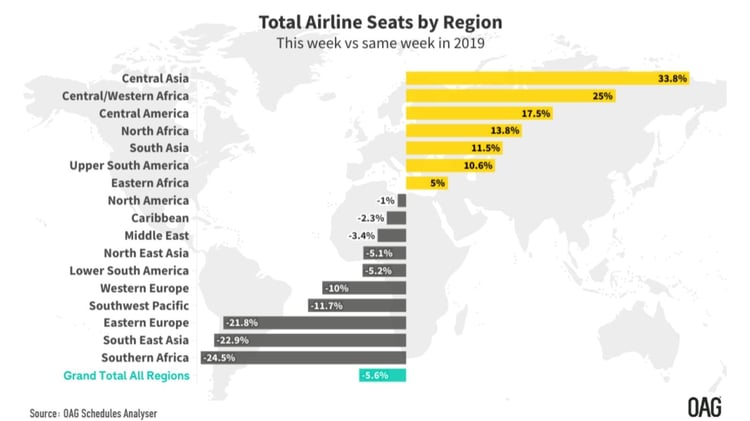
This infographic shows regions' recovery based on data from the week commencing 20th March 2023 vs the same week in 2019. 7 out of 17 IATA regions are now operating capacity that surpasses the level of 2019.

Uncertain Times for Regional Jets
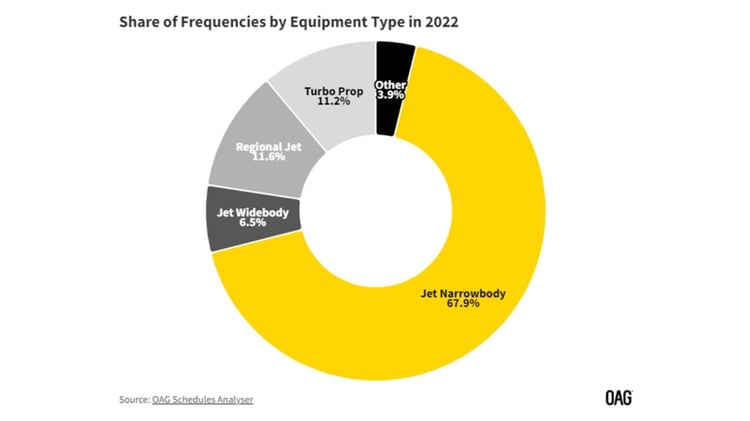
Regional jets saw a 33.5% decline in 2022 - while total airline frequencies were down 19.5%.
In 2019 regional jets represented 14.0% of all aircraft frequencies and this dropped to just 11.6% in 2022.

Now that you're up to date with this month, use the form below to subscribe and receive an update each time we publish an infographic.