
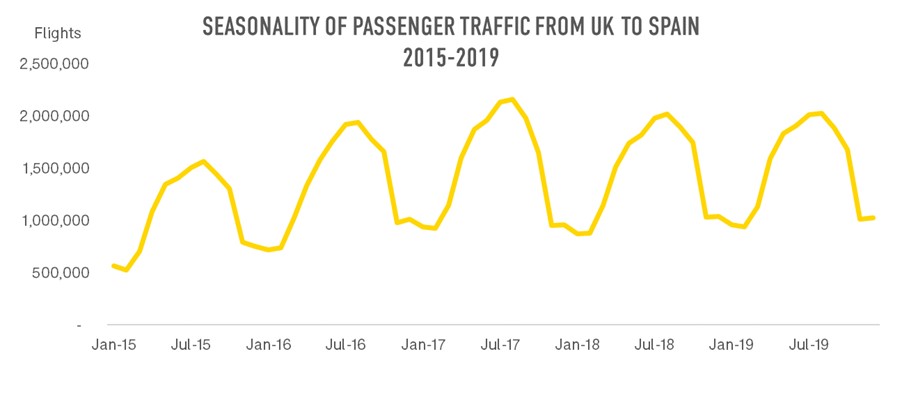
It may seem obvious that we can use past travel trends and travel patterns to predict the future. In aviation, we’ve been using techniques based on a detailed analysis of historic airline capacity and traffic to predict what the future demand for air travel might be. This works well up to a point. Think of seasonality. If the majority of travelers fly between two airports in the months between June and September most years, we can be fairly sure that will be the same next year.
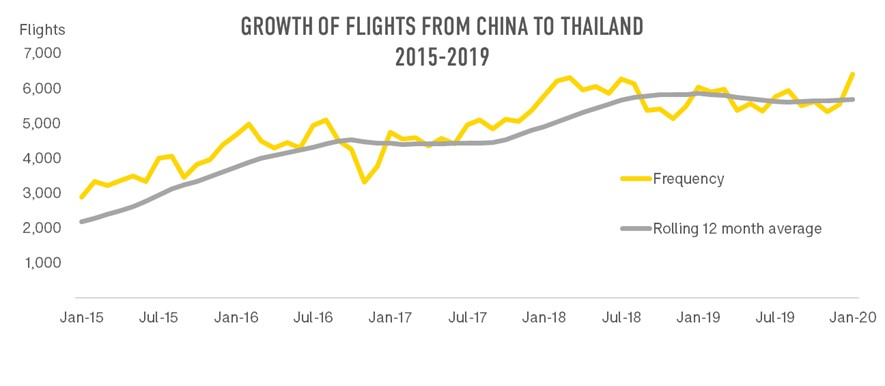
Similarly, if a particular market has been growing, say the market for travel from China to Thailand, and growth is observed as more passengers fly on direct air services and a greater number of flights being deployed by airlines year-on-year, then it’s reasonable to expect that trend to continue.
The problem comes whenever an event or ‘shock’ occurs such that the travel trends and patterns we’ve become accustomed to are disrupted. This happened with the September 11 attacks in 2001 when air travel came to a standstill and passengers feared flying. It happened again after the financial crash in 2007 as the global economy faltered. And then again in 2010 when the Icelandic volcano Eyjafjallajökull blew its top, albeit the disruption was more short-lived. In between these events the SARS outbreak, the H5N1 virus and the H1N1 virus also caused air travel disruption. In each of these instances, air travel returned to the previous growth trajectory before too long.
The two events with the largest impact were 9/11 and the financial crisis, but in each case global airline capacity returned, - more-or-less- to the growth trajectory it was on before the crisis within 12-18 months.
The current ‘shock’ is different. It may be longer-lasting, and the immediate impact has certainly been far more wide-reaching. No part of the globe is unaffected and the fact that nations have imposed restrictions on who crosses their borders has a very fundamental effect on air travel. The issues currently faced go beyond either supply-side issues or a drop in demand; some potential passengers are simply unable to travel and many airlines are making tough choices about what to operate given the rapid need to cut costs.
There are some aspects of future travel trends we already have an inkling about:
- Domestic travel is recovering faster than international air travel
- Passengers actively avoid hub airports for some time, preferring non-stop flights
- Leisure travel and visiting friends and relatives (VFR) may come back faster than business travel
- Younger people may have a greater appetite for risk and therefore be more willing to travel than older people
- Some corporate travel may not return at all as companies continue to use virtual meeting technology to replace face-to-face meetings
- A vaccine will go a long way to restoring confidence in air travel but will take time to roll out
- The economic impact of the pandemic will affect disposable incomes and should be expected to reduce demand for air travel
- Some airlines may not survive but there will be opportunities for new entrants and the potential for industry disruption.
So, with all this change taking place, how is it possible to look ahead and predict future demand? At OAG, we’ve made significant use of two specific uses of our flight data as we try to understand the trajectory of the impact on air travel through 2020 and beyond.
Use of "snapshots"
Both OAG Schedule Analyzer and Traffic Analyzer include a ‘snapshot’ feature that allows the user to extract the flight schedule or latest traffic data, including future travel bookings, for an earlier point in time. Traffic Analyzer is updated monthly and so the earlier snapshots are spaced at monthly intervals while snapshots of schedule data, which is updated weekly, are available at weekly intervals.
One example of the use of this in Schedule Analyzer has been to see how airlines have responded to travel restrictions and falling traveler demand by reducing their schedules. The diagram below shows global scheduled capacity by week for the whole of 2020, with various ‘snapshots’ of data superimposed. The earliest snapshot dates from 20th April and the most recent on the chart is dated 30th September.
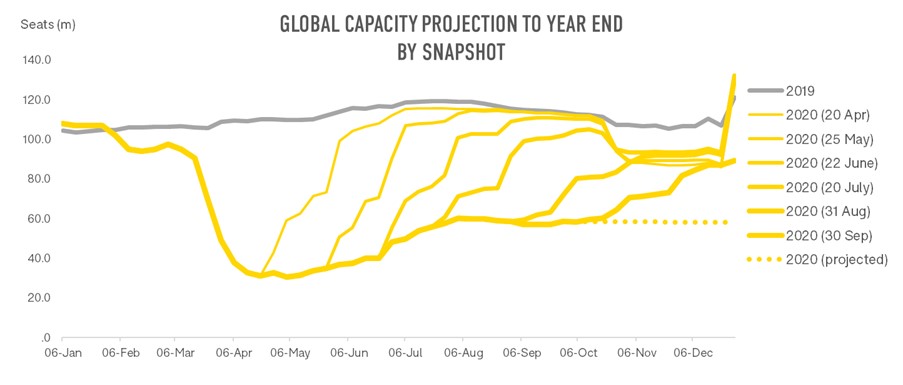
It is very clear that airlines were only adjusting their schedules for about 2 months into the future so in April the July schedule still appeared unchanged. By August, the November schedule was still unchanged. Displaying all these snapshots of the flight schedule together meant that it was easy to see that in all likelihood there was still considerable capacity to be removed from airline schedules, further damaging relationships with customers whose flights would be canceled. It was possible to project then that the year could end with global capacity at only around half of where it had been at the end of 2019, an outcome that came true.
Airline Capacity & Bookings Ratios
It’s not only general market trends that are of interest when it comes to understanding what the future might hold. Airlines need to understand what the prospects are for individual routes as they make decisions about where to prune networks and reduce costs. Snapshots are also useful here as they allow comparisons between two points in time.
Traffic Analyzer holds unadjusted booking data from Travelport, one of the leading GDS’s and, as the chart below shows, can be used to see how bookings for a specific point in time have changed in the months leading up to the month of travel. In this instance, the data shows bookings for flights between London Heathrow and New York JFK in June 2020, and the number of bookings held in the system in each month since January 2020. As expected, the bookings rise as the months go by, but fail to get close to the number of bookings for June 2019. A similar approach can be taken to reviewing capacity data and the chart shows that, unlike bookings, capacity has remained low in the months leading up to June 2020 and is even further from matching 2019 levels.
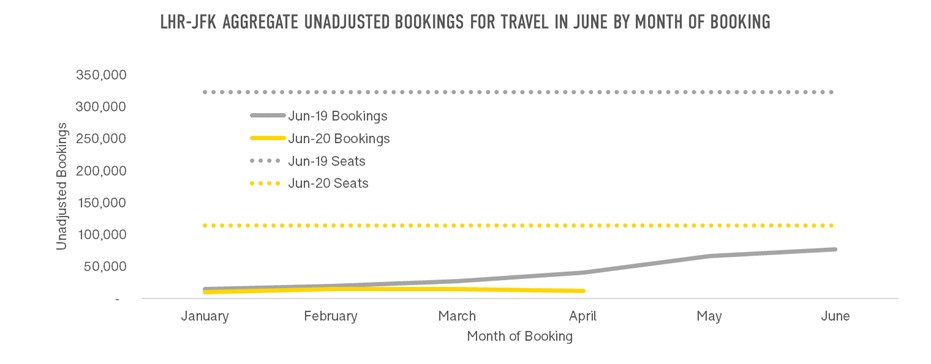
It is possible to encapsulate all this information into a single ratio:
| Bookings now for June 2020 as a percent of actual June 2019 bookings | : | Capacity now for June 2020 as percent of actual capacity in June 2019 |
In this example, the most recent bookings data was for April 2020 and the ratios can be calculated as:
16% : 35% = 0.45
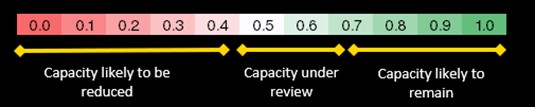
The scale below provides an indication of action needing to be taken depending on the value obtained. In this instance, the value of 0.45 diagram below showed that bookings were growing at a much slower pace than capacity and airlines would be looking seriously to reduce capacity on this route.
Covid recovery and the need for visibility of future bookings
As we already know, demand for air travel, and especially international air travel, is going to take a lot longer to return than following previous ‘shocks’. No-one yet knows whether demand will return gradually, or whether the world will reach a point where travel is deemed safe again. What we do know is that pent up demand for travel means that if it’s the latter, then there could be a surge in people wanting to fly while airlines scramble to keep up with demand.
Whichever pattern we see to air travel demand recovery, historical flight data provided by Traffic Analyzer enable customers to move through time to see how airline bookings have been changing, where demand is building and how booking patterns are changing by origin, by destination and even by nationality. Traffic Analyzer gives visibility and context around future bookings.
Traffic Analyzer holds a snapshot of bookings for every month going back as far as January 2019, well before the pandemic, and given that it includes booking data for future months, there is a wide window of data available to help understand booking behavior before and during the pandemic, as well as into the future. And understanding traveler behavior allows for smarter decisions for everyone steering their way through this difficult time.