Plus it's carnage in Europe as one quarter of capacity lost in a week.
It is another tough week for the industry so apologies in advance for the depressing news but just remember, 2021 will be a year of two halves and the second will be a lot better than the first.
The second full week of January shows a loss of four million seats week on week or nearly 7% of global capacity as a series of lockdowns are put in place around Europe which in turn has created a ripple effect into other smaller regions that are dependent on Europe for large parts of their capacity. Airlines are still grappling with the latest series of changes and we will highlight those in more detail later in the blog; we like to keep the best parts to last!
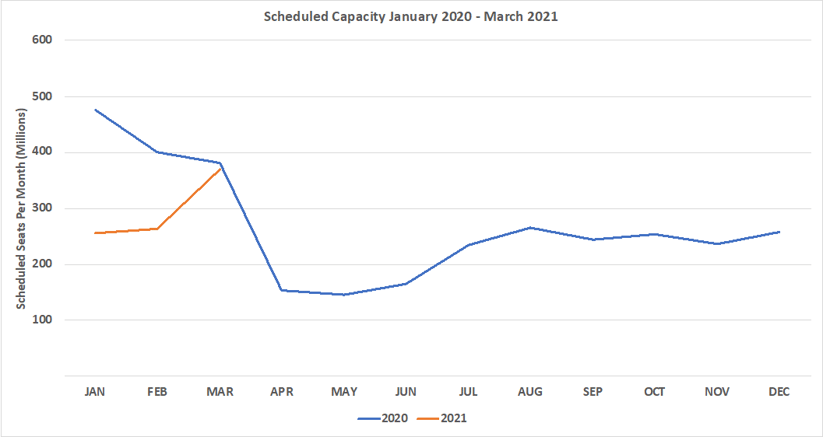
The chart below is a new version of the previous data we have shown here consolidated into a monthly format with year-on-year comparison for the next few months ahead. January 2021 is currently standing around 47% below last year and since we are only reaching halfway through the month that will slip further back as a combination of airlines are still working on changes and further travel restrictions are imposed. What is clear is that against a backdrop of little expected improvement in market conditions before the end of March there are over 350 million further scheduled seats to be removed by airlines around the world.
Chart 1 – Scheduled Airline Capacity by Month

Source: OAG
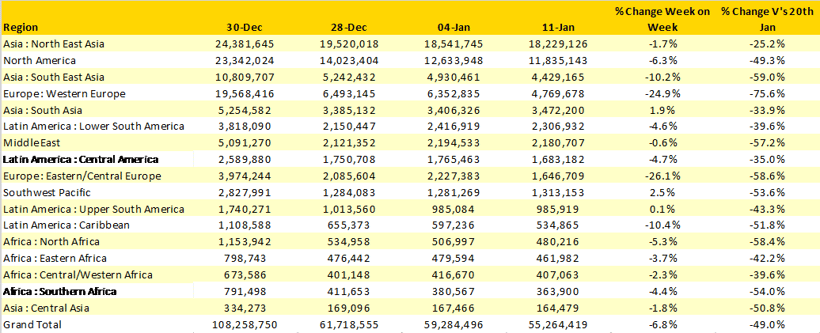
Global capacity stands at just half of the same week last year; during the course of the last year, it has at times reached nearly three quarters of what were the normal weekly levels but for every step forward there appears to be a subsequent couple of steps backwards. Only two (South Asia & Southwest Pacific) of the seventeen global regions report any real week on week growth; four regions report double digit reductions in capacity.
The speed with which most airlines have responded to the lockdowns in Western Europe is reflected in a 25% reduction in capacity week on week which leaves the region with just over 25% of the capacity operated this time last year. A loss of some 1.5 million seats in a week is staggering and with a further 580,000 from Eastern Europe disappearing then the expectations for the next few months are grim.
Table 1– Scheduled Airline Capacity by Region

Source: OAG
China remains the one market where capacity is close to historic levels although the mix of that capacity has changed dramatically; this time last year some international capacity was around 12% of all seats offered; this week it is just one percent. With the Chinese New Year a few weeks away a forward look at capacity suggest that further capacity growth is planned by many of the major domestic carriers but current concerns around another spike of infections could see that capacity fall and travel restrictions put in place.
If there is one bright spot, it is Australia which has now entered the top ten with some additional 50,000 seats week on week taking the country to around 46% of its normal levels. With Qantas now loading schedules for international flights in the second half of the year there is at least some hope of a longer-term recovery in the market.
In Western Europe is the largest loser of capacity week on week with over 350,000 scheduled seats wiped out and that is before the impact of Storm Filomena is added to the equation. By comparison the loss of some 260,000 seats in the UK market seems minor although for some smaller regional airports the loss of what services they did have is forcing short-term closures through to April.
Table 2- Scheduled Capacity, Top 10 Countries Markets

Source: OAG
The battle to claim bragging rights as the world’s largest airline based on scheduled capacity has seen American Airlines replace Delta once again by the smallest of margins. A “lead” of just 1,321 seats equates to less just an additional eleven flights putting Delta back into number one position. Whilst both American and Delta compete for the market leading position it is interesting to note that United Airlines; the other major legacy carrier are now operating less than half of their pre-covid capacity and losing ground on their major competitors although of course passengers are more important than seats!
Table 3- Scheduled Capacity Top 10 Airlines

Source: OAG
The dynamic nature of the market and the responsiveness of the airlines to what is being thrown at them on an almost daily basis is incredible. Every day appears to bring a new set of restrictions and airlines stoically adjust their schedules and submit them to OAG whilst in parallel asking for some sensible handling by regulators around the globe. Our expectation is that such changes will increase in the next few weeks as carriers make the changes to remove those 350 million seats that are currently in the system but for which there are either restrictions or no demand.
We will of course keep reporting on those changes but as an advanced warning,things can only get better!
Stay safe everyone.


.jpg)


.png)


