
It was the peak!
This week’s latest scheduled capacity data shows a further reduction with the loss of some 700,000 fewer seats reported this week. That’s a reduction of just one percent and exactly the same percentage of capacity at 50.6% of last year’s level as we reported for week thirty-one. This is now the third consecutive week of global capacity falling back; that seems like the beginning of a trend to me.
The key question is, have we just stopped for a rest following a reasonable growth spurt in July or was that the height of our achievement this Summer in the new normal Covid-19 world? Thoughts anyone?
Between last Monday and today airlines shaved a further 2.2 million seats off their planned capacity for this week; a 4% reduction and we should expect further cuts in capacity this week as well. Ryanair’s announced 20% reduction in capacity for September has yet to be reflected in the data and that will amount to around 400,000 seats a week and we should expect other carriers to make similar adjustments in the next few days as September schedules are finalised.
Chart 1 – Scheduled Airline Capacity by Week Compared to Schedules Filed on 20th January 2020 & Previous Year
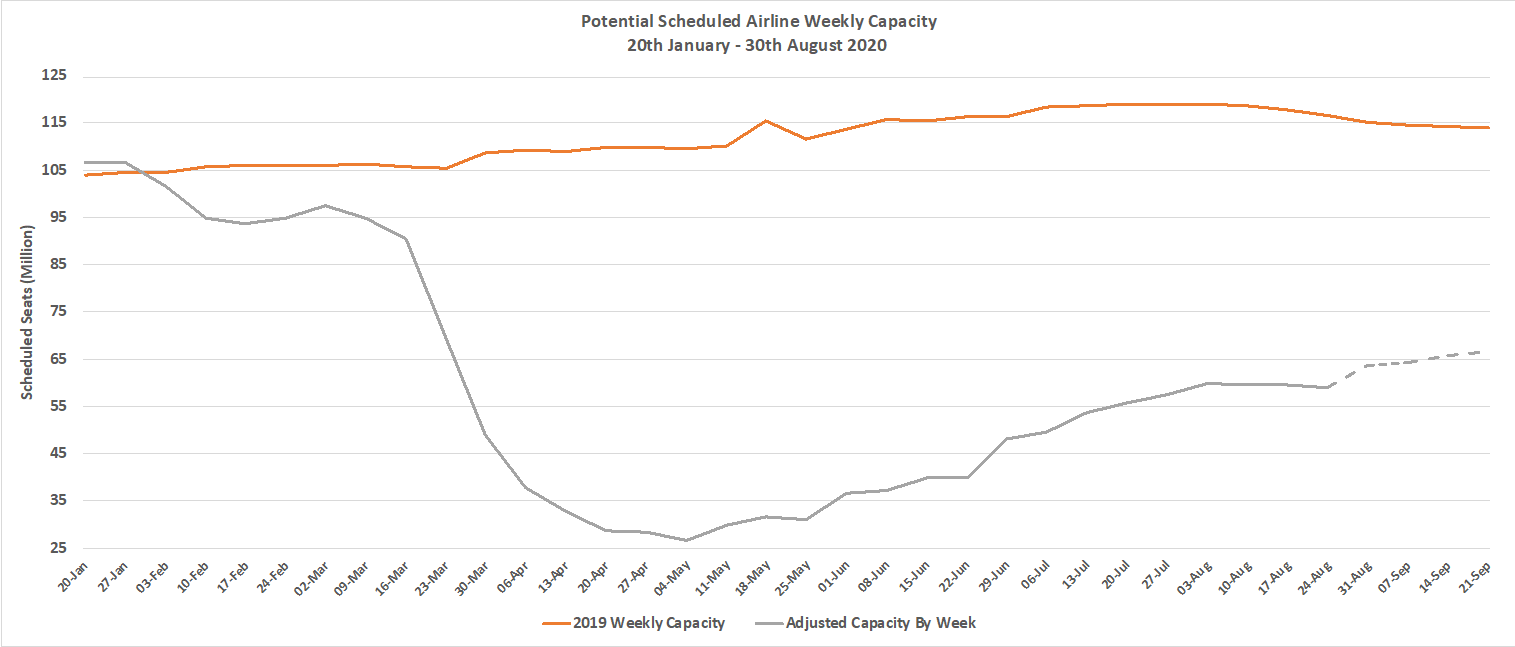
Source: OAG
One of the greatest barriers to any further recovery remains the lockdowns and travel restrictions between various regions of the world which are becoming increasingly frustrating for both airlines and potential travellers. The table below shows the changes in capacity across a number of major regional markets since January and highlight that what capacity recovery there has been is very much within each IATA geographic region. In particular, the normal weekly capacity flow between North East and South East Asia of over 1.8 million seats a week is now less than 10% of that mark; damaging airline balance sheets throughout the region.
Table 1 – Inter Regional Capacity, Selected Markets W/C 20th January V’s W/C 24th August 2020
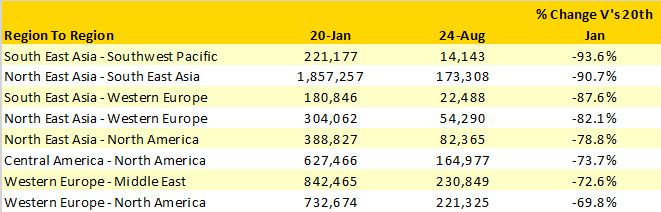
Source: OAG
When the headline numbers are very similar week on week then the regional numbers are also pretty similar to the last week! Fortunately, there are always a few devils in the data. In South East Asia total capacity has fallen by some 9% as both Indonesia and Vietnam wrestle with increasing infection rates and in South Asia both India and Bangladesh have capacity cuts week on week.
Amongst the major market regions, the “fastest” growing market this week and winner of the world’s 5 metre snail race is Lower South America with some 10,700 new seats; that works out at eight additional flights a day for those keen on plane spotting. And of course, Lower South America with just 22% of its January capacity level remains one of the weakest markets in the apparent recovery process.
Outside of the major regional markets, Southern Africa has had a good week. Capacity has increased by 17% week on week and nearly all of that capacity growth is in South Africa which of course probably means another airline failure or Chapter 88 event (SAA in Chapter 11 once again perhaps) is getting closer every day.
Table 2 - Scheduled Airline Capacity by Region, 20th Jan – 30th August 2020 by Region
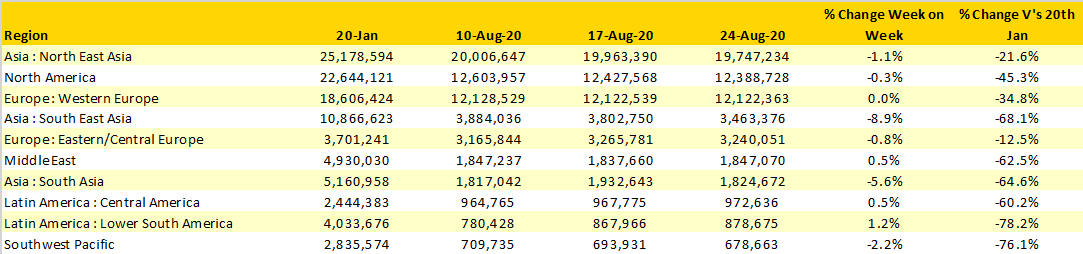
Source: OAG
Within the top ten country markets, a beady eye will notice that both India and Indonesia have slipped down the table; some of you may even notice the pun. The impact of Japan’s two largest airlines adjusting their weekly capacity rather than increasing their weekly rate of cancellations is reflected with a near 9% reduction week on week. We should of course expect to see on time performance begin to improve again in what has traditionally been one of the most punctual markets in the world.
Fortunately, none of the countries currently on the UK Governments hit list for a surprise quarantine announcement at 17:00 on a Thursday and subsequent twenty-four-hour race home to avoid quarantine are in the top 10 global markets. To give you an idea of the impact of the UK’s “blunt instrument” approach as of the 3rd August there should have been some 411,000 weekly seats from the UK to Spain and France; there will actually only be some 54,000 seats. Just how many aviation, travel and tourism jobs will be lost as a result of that blunt approach.
Table 3 - Scheduled Capacity Top 10 Countries Markets
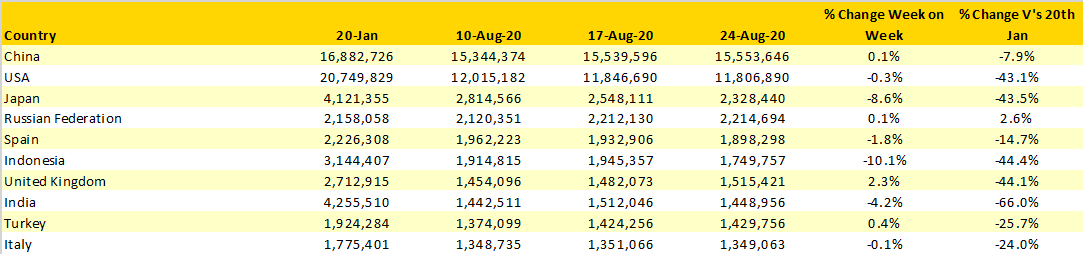
Source: OAG
Southwest Airlines continue to hold the title of the world’s largest airline as they continue to be one of the few airlines operating close to or over 80% of their January schedules. Looking at some data last week it was interesting to see that where Southwest operates to a secondary airport in a major US city (Chicago Midway, Washington Baltimore etc) the comparative performance of those airports is much better than their larger airport competitors.
Table 4 – Scheduled Capacity Top 10 Airlines
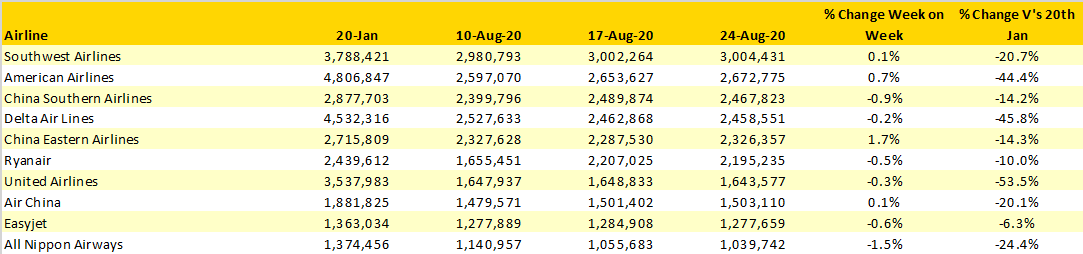
Source: OAG
This week some 646 airlines will operate scheduled services compared to 714 in January; at the lowest point in the Covid-19 crisis we were down to just 544 scheduled airlines operating and very importantly global capacity has almost doubled since the week of the 11th May. How much of this week’s flying will be profitable or even cover DOC’s when yields are apparently falling quite heavily at the moment remains to be seen. If the current levels of capacity are part of a very slow but cautious recovery where operating cost are at least covered then that would be a positive way forward but with load factors on many services still very low that is perhaps a step too far at the moment..