

Network planners are on holiday this week. With only a 67,000 change in global seats this week compared to last week; less than 0.2% change it could be assumed that those planning scheduled have either given up trying to plan around lockdowns and quarantines or taking a well-deserved rest. Unfortunately, that 67,000 is a reduction on last week’s capacity and we are now at 58.2 million weekly seats; that’s an 11% increase over the last four weeks leaving us with just over (50.6%) of the capacity available last year.
Typically, the last full working week of December sees global capacity at around 10 million seats less than a typical week in August; extrapolate that forward and we could be looking at some 48 million scheduled seats a week in December this year. That would equate to a decline year on year of some 62 million seats or a decline of 57% year on year.
Since the middle of February when capacity began to decline there have been some 1.6 billion fewer seats operated than in 2019. Assume 75% of those seats were occupied and an average yield of around US$150 and the scale of revenue losses comes sharply into focus. That is a lot of revenue!
Chart 1 – Scheduled Airline Capacity by Week Compared to Schedules Filed on 20th January 2020 & Previous Year
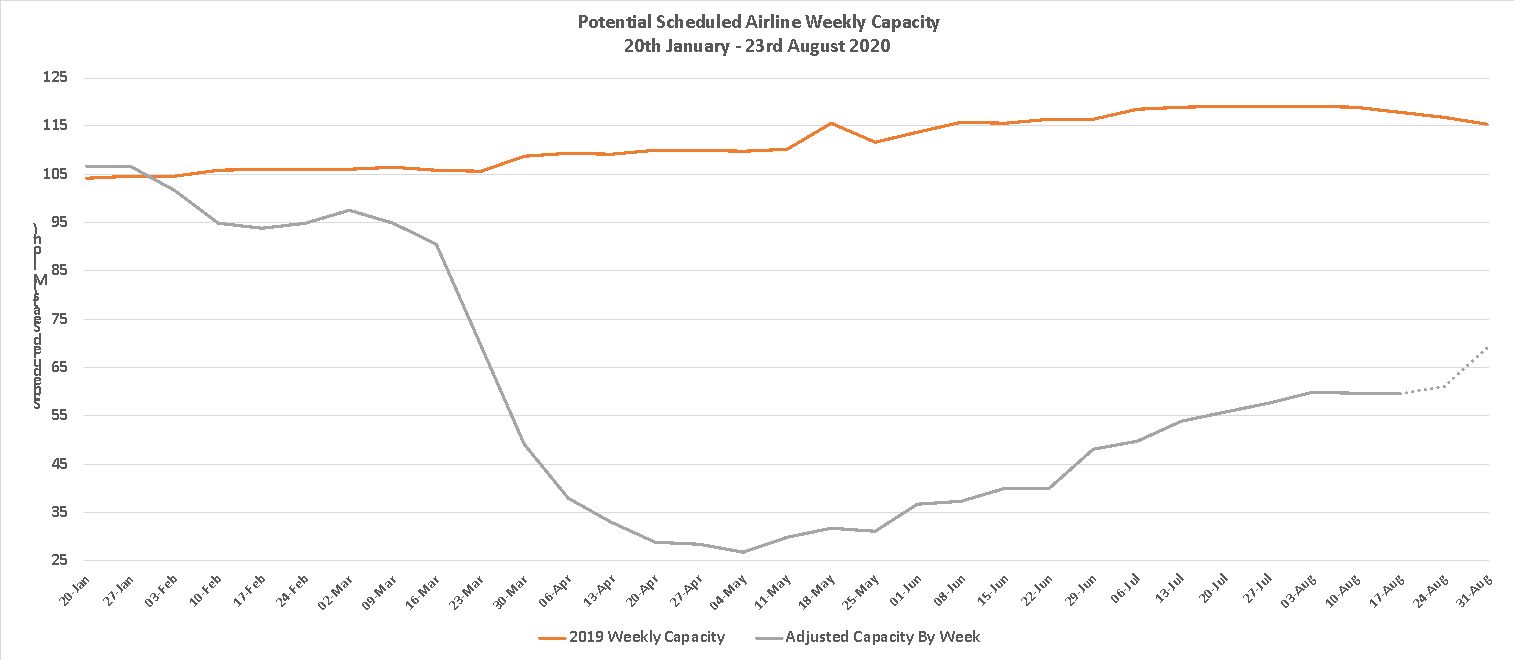
Source: OAG
Two regions have seen quite strong growth in the last week; Lower South America and South Asia although in the case of Lower South America scheduled capacity remains at less than one quarter of the January level. In fact, six of the top ten regional markets remain at below half of their historic capacity levels and in many cases have been “treading water” for the last few months.
Upper South America (Colombia, Peru, Venezuela etc) remains the region continuing to report the largest percentage decline in capacity since January with Colombia in particular at less than 2% of its base capacity point and in virtual lockdown for any scheduled airline services.
Table 1 – Scheduled Airline Capacity by Region, 20th Jan – 23rd August 2020 by Region
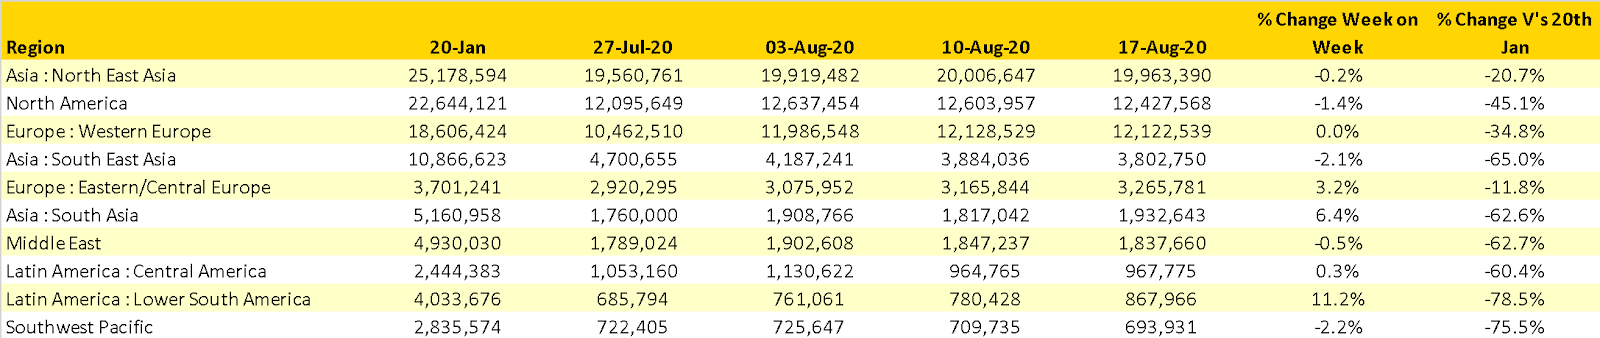
Source: OAG
The top ten country markets are the same ten as last week with the only movement being India moving ahead of the United Kingdom. Japan remains in third spot but a 9.5% reduction in capacity as a result of ANA dropping some 86,000 seats this week places the country at risk of being overtaken by the Russian Federation in the coming weeks. The Russian Federation is the only country market to be reporting capacity growth above their January base point; perhaps proving the value of having a vaccine available for all!
Table 2- Scheduled Capacity, Top 10 Countries Markets
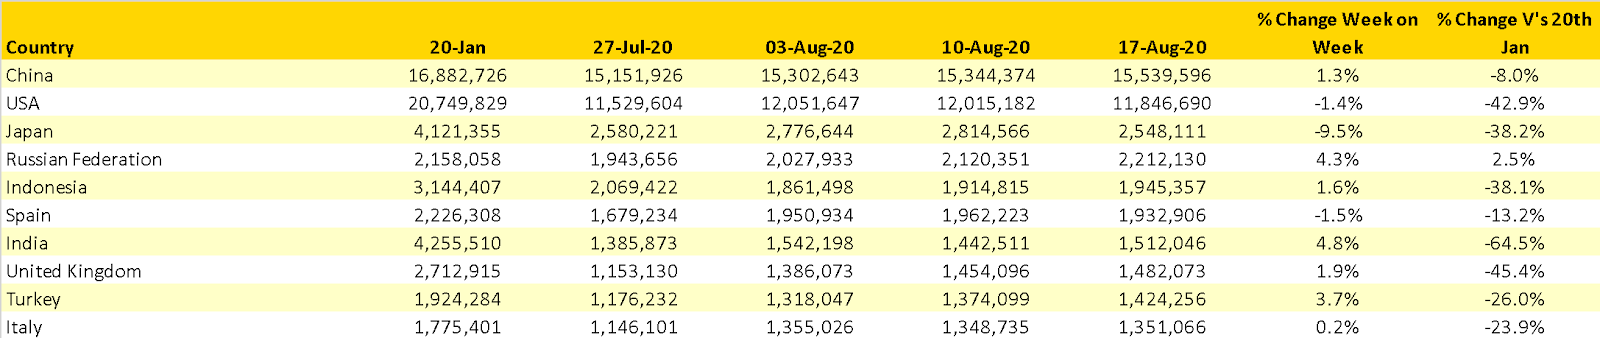
Source: OAG
Ryanair’s bullish growth reflects some adjustments in the coding of their flights between their airline operating divisions (Lauda and Malta Air) but now moves them to the largest airline outside of the United States and China with some 2.2 million scheduled seats a week. ANA’s capacity reduction sees them drop to tenth place in the table but with some 200,000 seats a week more than eleventh placed Turkish Airlines their place seems assured for the next few weeks at least.
The news that authorities in Singapore are looking at ways of facilitating more transfer traffic will be welcomed by the local airlines; Singapore Airlines in particular are still only operating some 6% of their normal capacity with more than half a million seats a week not being operated at the moment. Meanwhile, further north, Cathay Pacific who were already impacted by political disturbances before Covid-19 are only operating 11% of capacity.
Table 3- Scheduled Capacity Top 10 Airlines
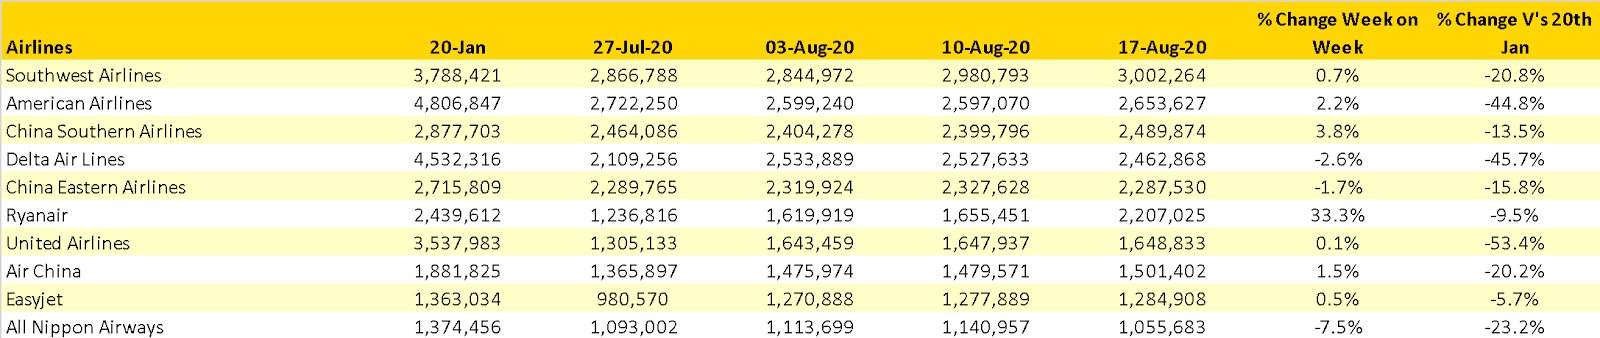
Source: OAG
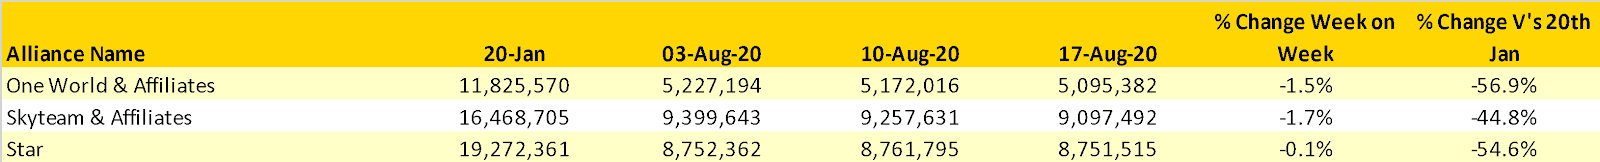
With capacity data showing only the smallest of changes this week we’ve taken a look at how capacity has changed across the three major airline alliances during Covid-19. Given that Skyteam, at least for now, appears to have been slightly less impacted than its two competitors. This can in part be explained by some of their members; Vietnam Airlines, Aeroflot and Xiamen Airlines operating at very near to normal capacity levels.
Table 4 – Alliance Capacity
Source: OAG
The early indication for capacity in the next few weeks points to similar levels of capacity as reported this week. In some markets the first week of September is being seen as the point of recovery with various government restrictions planned to ease; however, some countries are already extending those restrictions to the end of the month. South America in particular appears to be a region where additional capacity is very unlikely before the end of September which may impact the potential for COPA in particular to reopen their Panama hub in the next few weeks.
Overlay those challenges with escalating infection rates in most parts of the world and IATA’s forecast of an industry loss of US$84 Billion this year looks as optimistic as Brighton winning the Premier League; miracles do happen but expect that US$84 to be closer to or indeed higher than US$100 Billion by the end of the year.
The sooner 2020 disappears then the better for everyone!