

Traditionally the next week is one of the most impressive displays of the success of the airline industry, the Big Three US carriers announce their third quarter earnings which cover the July to September period; the peak months of travel in many markets. Last year United Airlines reported net income of US$1.0 Billion, Delta Air Lines adjusted revenues of US$12.6 Billion and American Airlines paid some US$44 million in dividends in the quarter. This week’s numbers will be slightly different but equally newsworthy.
Global capacity has shrunk week on week by less than 1% but has again fallen below the 57 million mark as some quite large changes in capacity by country impact the sum. With rumours of up to 40% of US domestic capacity at risk without a second CARES act the forward-looking picture is not good; of course, that is just rumour. What we do know is that the first week of the IATA Winter Season is now only two weeks away and typically capacity in that week is around 5 million seats lower than this week; anyone for 50 million by then?
With some larger country markets showing quite strong growth in recent weeks we may not quite reach that psychological point but with other markets showing rapid slowdowns in capacity we may not be far off as the clocks go back in London.
Chart 1 – Scheduled Airline Capacity by Week Compared to Schedules Filed on 20th January 2020 & Previous Year
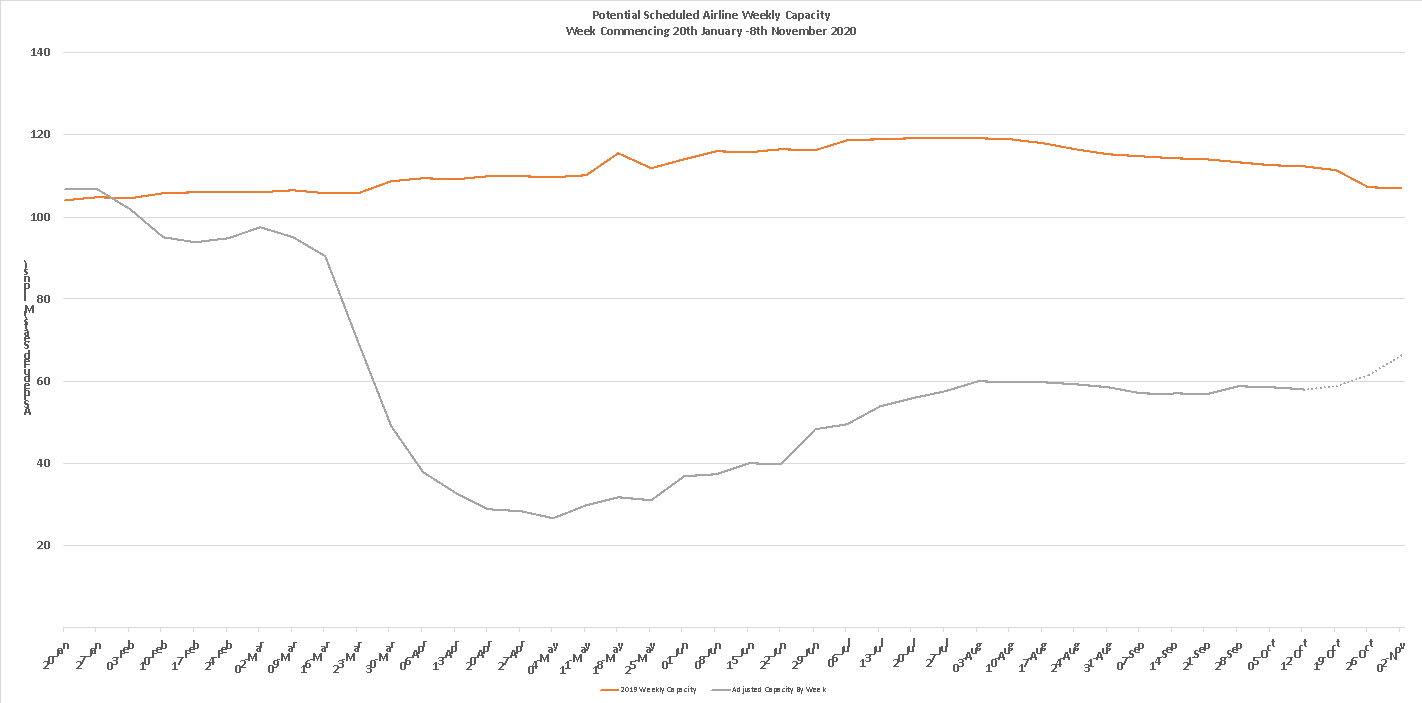
Source: OAG
Since flying to many defies all physical logic, it’s no surprise that despite what is currently happening in the United States that the North American region has seen a near 2% increase in capacity this week and has again broken through the 12 million seat mark. Latin America has also had a strong week for capacity growth with some 180,000 additional seats (+12.7%) being added in the last seven days.
The Southwest Pacific region remains the weakest performer with only 29% of the January capacity operating. With both international and local lockdowns the region has been hard hit and capacity through the rest of the year looks broadly similar to this week. In January there were some 3,748 flights international flights from the South-west Pacific, this week 336 highlighting just how locked down travel is in the region.
Table 1– Scheduled Airline Capacity by Regions
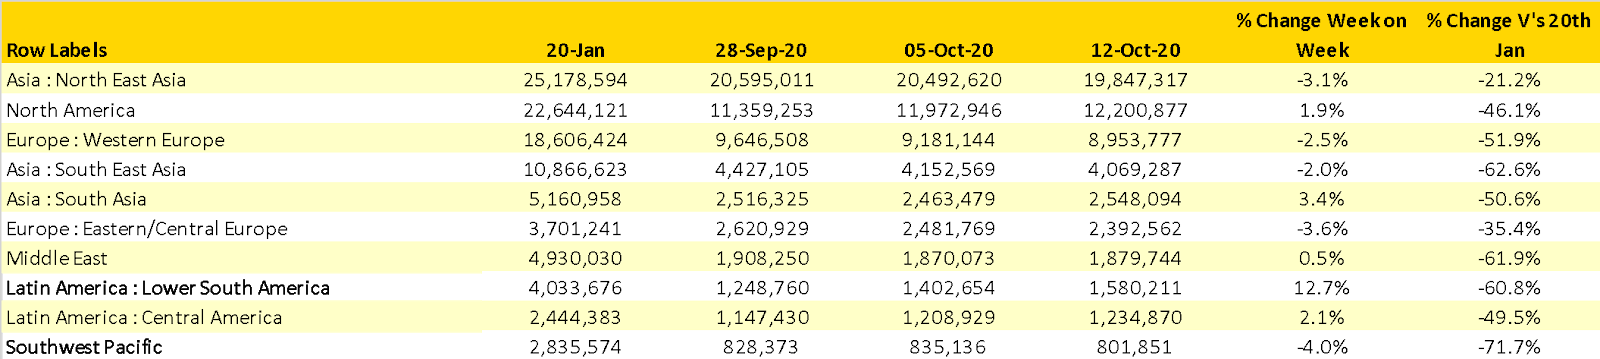
Source: OAG
The top ten country table sees Spain drop out at the expense of Mexico although the two country markets are so similar in size that a couple of flights either way changes the outcome.
China continues to be the single largest country market and will probably hold that chart topping position longer than Queens’ Bohemian Rhapsody (14 weeks if you are interested) given the market is over one-third larger than the United States.
The only other significant change is in Brazil where capacity has increased by 9.6% week on week. Both Gol and Azul have added capacity, GOL: a further 80,000 seats a week and Azul a slightly less aggressive 28,000 but both airlines are clearly looking to rebuild as the market slowly recovers. Elsewhere in Lower South America, Argentina is beginning to show some modest signs of recovery with some 62,000 domestic seats added in the last week, a 620% increase! International capacity however remains stuck at less than 1,800 seats a day.
Table 2- Scheduled Capacity, Top 10 Countries Markets
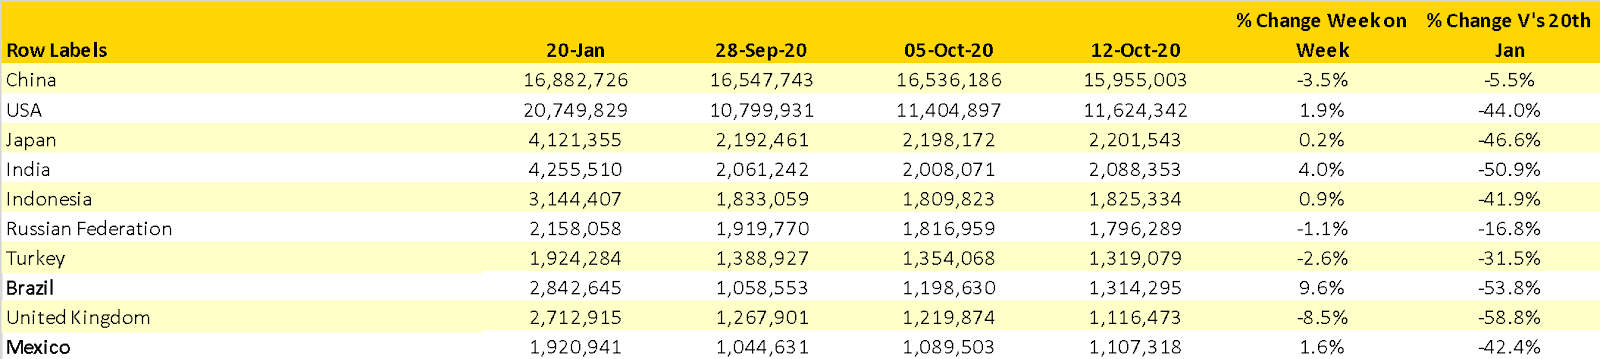
Source: OAG
Delta Air Lines have this week become the world’s largest airline based on capacity; not sure it will make the financials any better later this week but at least it provides a positive headline to start their earnings update and indeed this blog.
The announcement from easyJet this week that they expect to make a loss this year cannot have surprised many people, the airline dropped another 38,000 seats this week bring their running total for the last five weeks to some 420,000 or a 44% reduction in capacity; over five weeks that is some network adjustment. By means of comparison in that same time period Ryanair have reduced capacity by some 338,000.
In January some 714 scheduled airlines filed weekly capacity updates, this week that is down to 650 as a number of carriers have failed to survive the impact of Covid-19. In addition, some carriers continue to operate almost skeleton networks. Singapore Airlines will this week hope to operate 182 scheduled services compared to 1,821 in January; just 10% of the historic level even with my simple maths. And Cathay Pacific will hope to launch 322 scheduled services, compared to 1,850 at the start of the pandemic; my calculator tells me that’s just 17% of their January levels. Calculator or fingers, those numbers are not great for either airline.
Table 3- Scheduled Capacity Top 10 Airlines
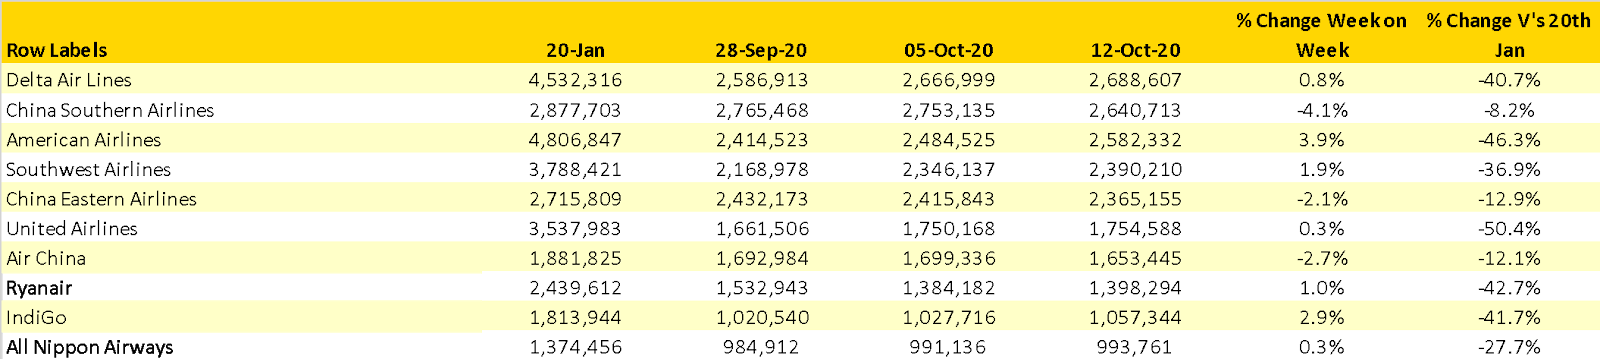
Source: OAG
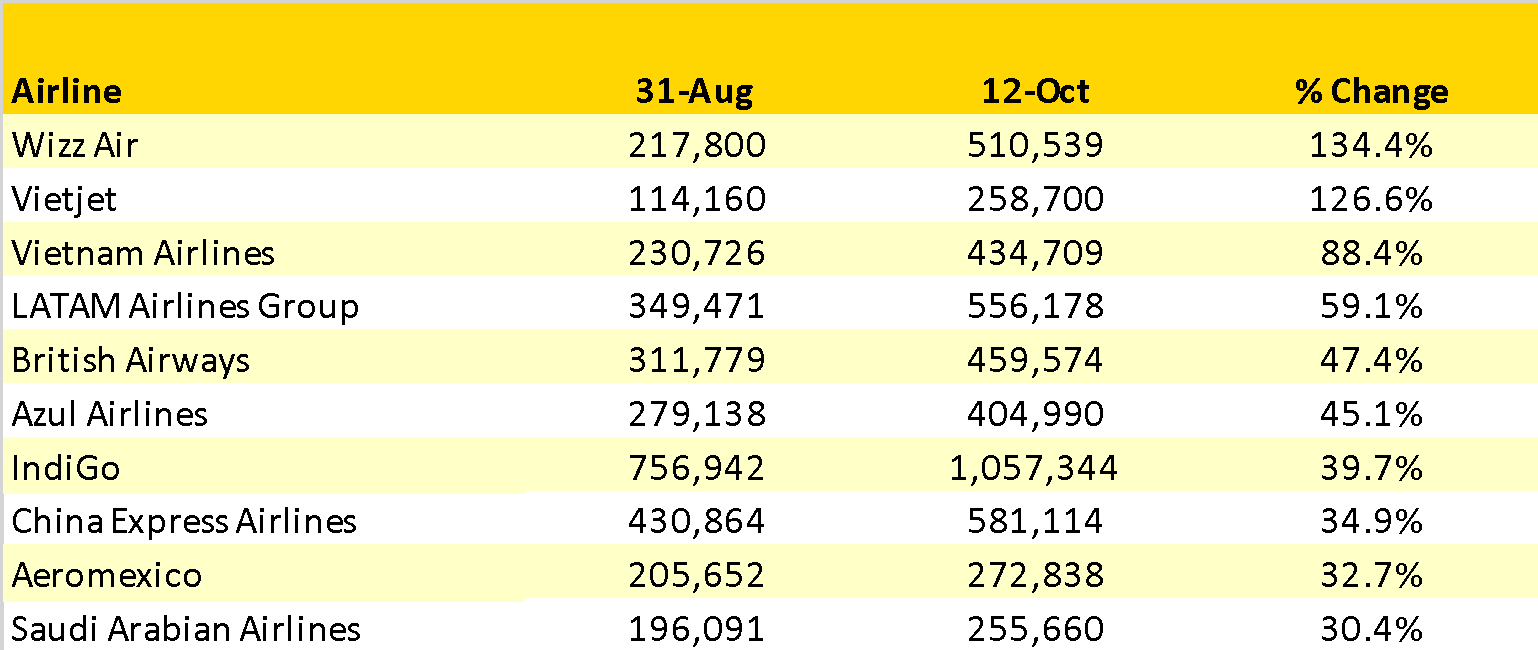
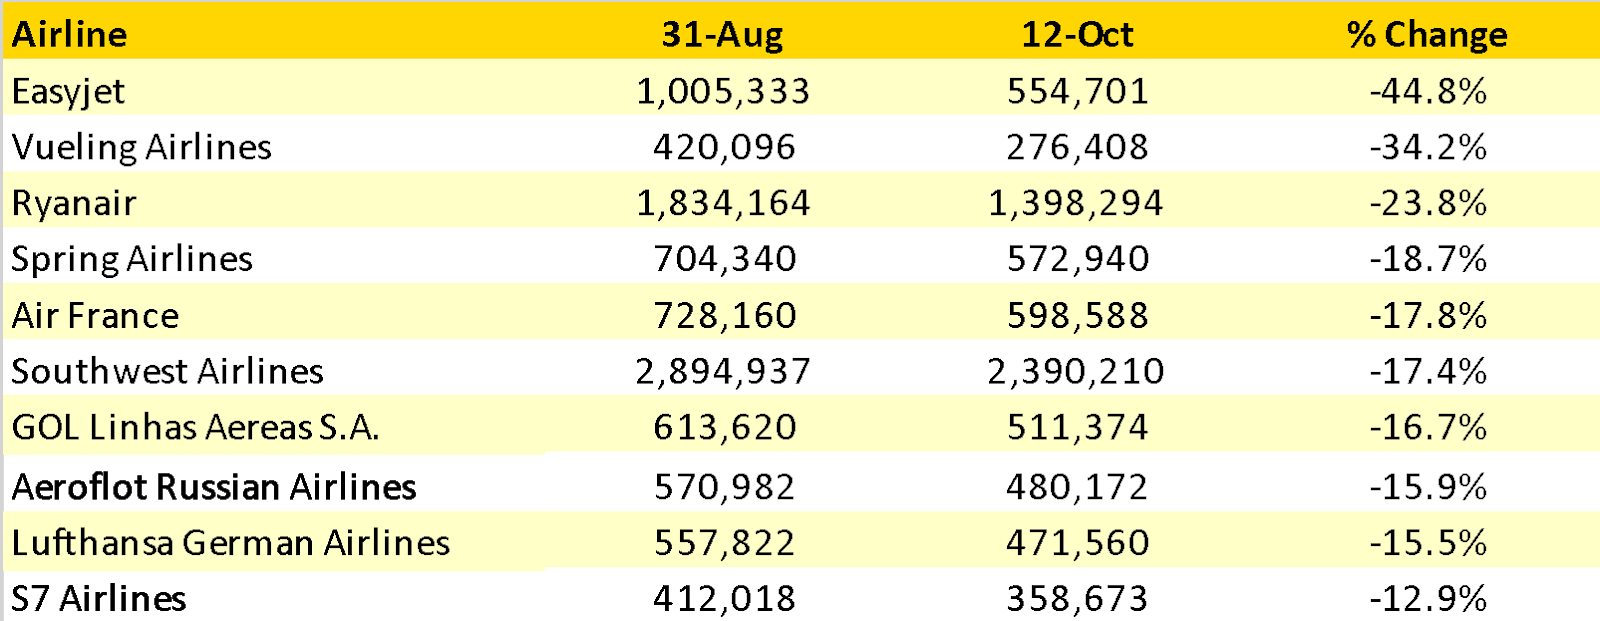
Taking a quick glance back at some historic data we have also this week looked at those carriers both adding the most and sadly cutting capacity since the first week of September with a minimum capacity threshold of 200,000 seats operated in September.
Many of those carriers that have reported large increases in capacity have “benefitted” from the reopening of their home markets with the two major Vietnamese carriers in the top three carriers. Wizzair always seem to appear amongst those with the highest growth rates but they are adjusting capacity on a daily basis and at very short notice; essentially what you see isn’t always what you get’ some wizardry taking place each day!
Surprisingly, and in contrast to its rivals, British Airways continued their remarkable capacity growth ranking fifth with some 47% growth whilst both easyJet (-45%) and Ryanair (-23%) have cut capacity. Today’s events at IAG are I’m sure unrelated to just that key stat.
Table 1- Capacity Winners & Losers Last Six Weeks
Source: OAG
From all of the positive feedback last week, well in truth just a brief comment from one person we are tracking changes to total Winter capacity versus last year on a regular basis going forward. The usual caveat around some markets filing their airline capacity later than others will always be a challenge in this measurement and especially for China but it does nevertheless give an indication of operating carrier sentiment. And it’s not good…..
Current scheduled capacity for this winter is around one-third of that operated last winter season and in major markets such as Western Europe, South East Asia and the Middle East, planned capacity is even lower. If anyone didn’t understand the scale of the issue then these numbers are as bad as Manchester United’s defence at the moment.
Table 4 – Winter 2020/21 Regional Capacity V’s Previous Winter Season
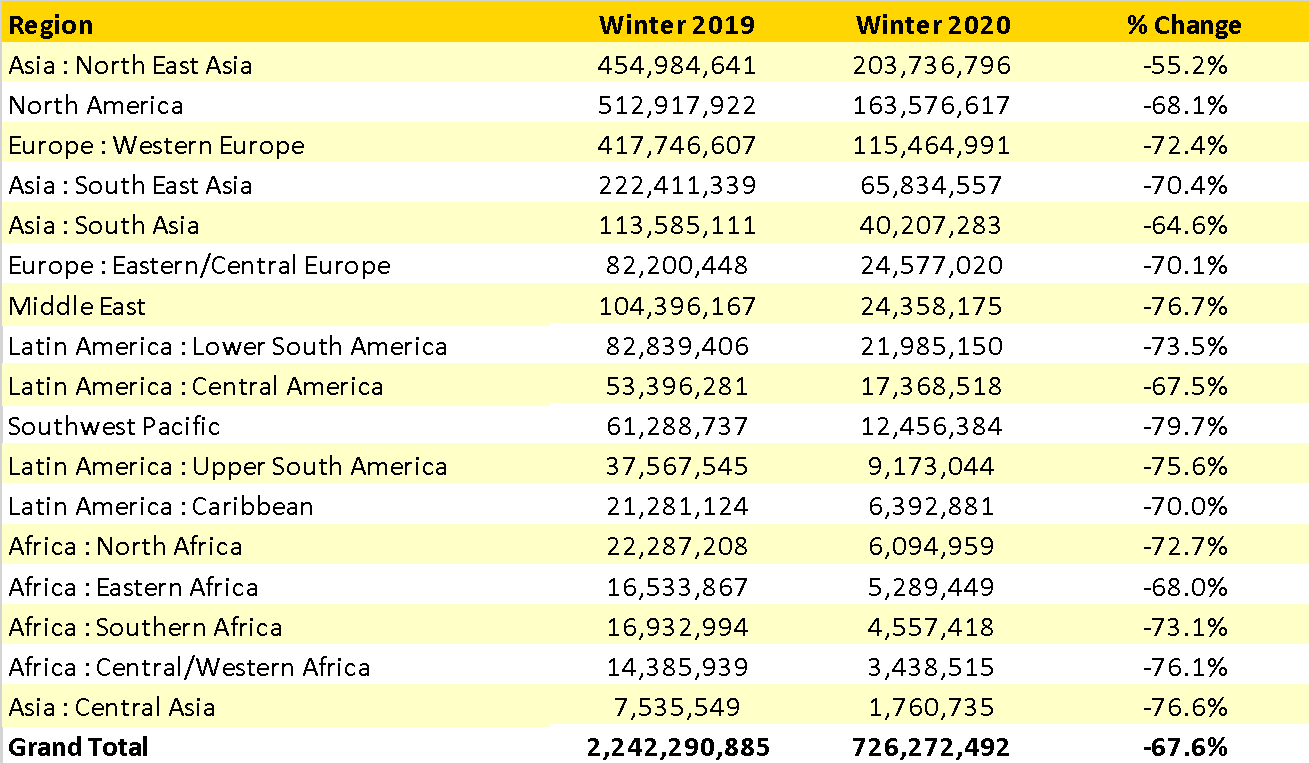
Source: OAG
Our expectations for the rest of 2020 are grim; there is no reason for any optimism at the moment. Airlines are trapped by issues that they have no control over and those with control have no idea of how to solve the problem. Winter 2020 is a very real and serious issue for the airline industry BUT Summer 2021 is already at serious risk of any recovery unless breakthroughs happen sooner rather than later. Cash reserves are being drained every day; IATA estimate that the industry has received over US$180 Billion of Government support and that the median airlines cash will last a further 8.5 months…five of those will be in the winter season; that is not good.
Have a good week everyone, we need one!