
Tracking the impact of COVID-19 suddenly got a lot harder this week, if it wasn’t difficult enough already. Saturday evening saw Delta Air Lines alone file some 89,000 schedule changes in just one update sent to OAG as airlines in some parts of the world continue to dramatically cut capacity whilst in other parts others cautiously add back capacity.
Keeping up with the rate of changes, adjustments to relaunch dates, regulatory lockdowns and of course the increasingly sad loss of airlines and skilled staff across a global industry.
At the moment those dramatic cuts are outstripping those small shoots of optimism, some 270 airlines added capacity back to the tune of approximately 3.9 million seats; unfortunately, 303 airlines reduced capacity by some 5.6 million including over 1 million fewer seats from Southwest Airlines.
Global capacity has now fallen to 26.6 million seats a week compared to some 109 million in the same week last year. Whilst the rate of weekly capacity continues to decline it does at last feel as though we are getting closer and closer to the bottom. After all, how much further can capacity fall.
The month of May has been seen by many airlines as a target date for capacity being added in some shape and form as the chart below shows current planned capacity for the weeks of the 11th – 25th May. Current scheduled capacity shows potentially nineteen million seats being added back in three weeks; a near 70% increase in three weeks. That is not going to happen! It does however show how difficult it is for the airlines working their way through and out of COVID-19, adjust capacity on a near weekly basis and then adjust again, and again.
Chart 1 – Scheduled Airline Capacity by Week Compared to Schedules Filed on 20th January 2020 and Previous Year
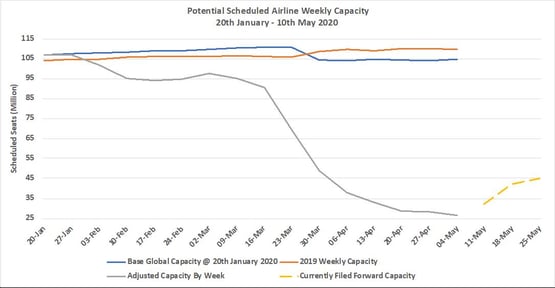
Source: OAG
North East Asia remains the largest regional market in the world with a 6% increase in capacity week on week. China’s national holiday and an easing of travel restrictions in the country is behind a near 900,000 increase in domestic capacity as carriers seek to stimulate demand with some very cheap air fares and rebuild confidence in the market.
The gradual easing of travel restrictions in Western Europe is supported by a near 4% increase in capacity week on week although in total the market remains at just above 10% of the capacity available in January this year. Key country markets such as Italy, Germany and the United Kingdom all have some degree of capacity growth week on week with just over half (26,000 seats) of Italy’s increase being coming from domestic capacity.
Table 1 – Scheduled Airline Capacity by Region, 20th Jan – 10th May 2020 by Region
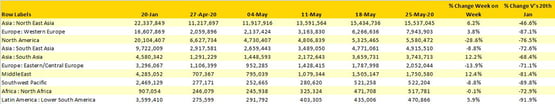
Source: OAG
Domestic capacity continues to account for over 82% of all seats scheduled for operation this week. Southwest Airlines dropping over one million seats in the last week moves the airline into second position in terms of global rankings; China Eastern now occupying first place.
Chart 2 – Domestic & International Capacity Splits, All Markets
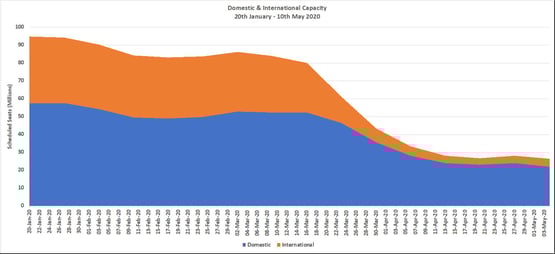
Source: OAG
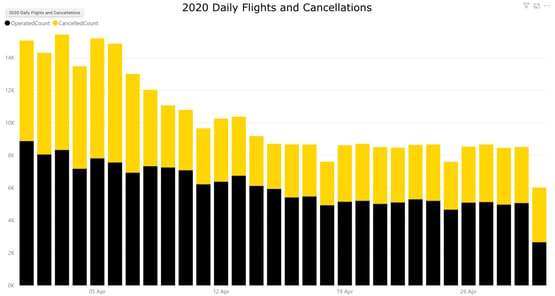
In total some 1.8 million domestic seats were removed from the US market this week and some 14,300 flights with all of the “Big Three” carriers reducing capacity further. In the last few weeks we have been reporting exceptionally high levels of flights cancellations in the US domestic market as airlines grappled with the complex operations and consumer demand whilst in some cases observing the principles of the CARES Act.
The chart below shows the operated and cancelled flight count for US Domestic services in April 2020; in total over 125,000 flights were cancelled representing around 39% of all those scheduled. In the last week of April some 23,600 flights were cancelled; the collectively removal of those 14,300 flights each week may result in the cancellation rate falling in the coming weeks but certainly not returning to the normal low levels the industry has come to expect.
Chart 3 – US Scheduled Domestic Capacity and Cancellations, 1st April – 30th April 2020
Source: OAG
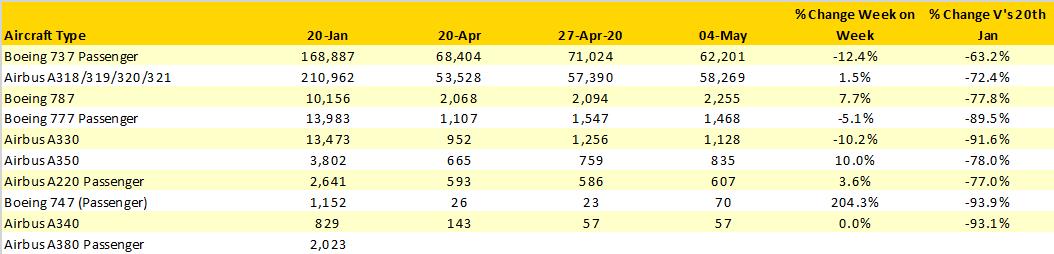
Taking a slightly different angle on the data, we have looked at scheduled services by aircraft type to track exactly what is happening in the global market, especially in the context of wide-bodied operations. As the table below shows and as probably most of us expected the A380 is currently on “gardening leave” with no scheduled flights planned this week. Wide-bodied aircraft are operating fewer than one in four of the services scheduled in January. The combination of “stronger” domestic supply and shorter sector lengths naturally plays to the single-aisle models such as the B737 and A320’s and indeed if there is any “good news” for Boeing in another bad week the B737 appears to have been the most resilient aircraft in terms of continued operations; much of which was Southwest related.
Table 2 – Scheduled Services by Aircraft Type, 20th January – 10th May 2020
The first week of May could have been perhaps too early a date to begin seeing capacity coming back but there are some positive signs. Country markets such as Vietnam, Spain, Oman, France and Colombia all report increases in weekly capacity offering some hope that capacity is growing in markets around the globe rather than just North East Asia.
However, this week’s data also highlights both how difficult and slow the capacity growth could be in the coming weeks. Many major airlines are now at the point of reshaping operations, adjusting networks and fleets as we prepare for the post COVID-19 industry and it could be a very long journey back to 109 million seats a week in that new world.
Only time will tell.