
Coronavirus Capacity Update Week Forty-Eight: Second guessing global capacity has been difficult this year and the last few weeks have seen us settled at around 55 million seats a week although with numerous fluctuations in regional markets. So quite how in the last full week before the year-end holidays we have a near 9% increase in capacity and some 4.8 million seats week on week; maybe there is a Father Christmas after all!
This week’s capacity levels are the highest since the week of the 3rd August when the sun shone, airlines were adding capacity back at a rapid rate and much of the globe seemed to have worked its way through the first wave of the pandemic. Quite what we can make of the increased capacity we can see this week and much more importantly the anticipated demand is anyone’s guess. Current capacity filed for next week suggests a week of over 62.5 million; could we really hit such giddy heights?
Chart 1 – Scheduled Airline Capacity by Week Compared to Schedules Filed on 20th January 2020 & Previous Year
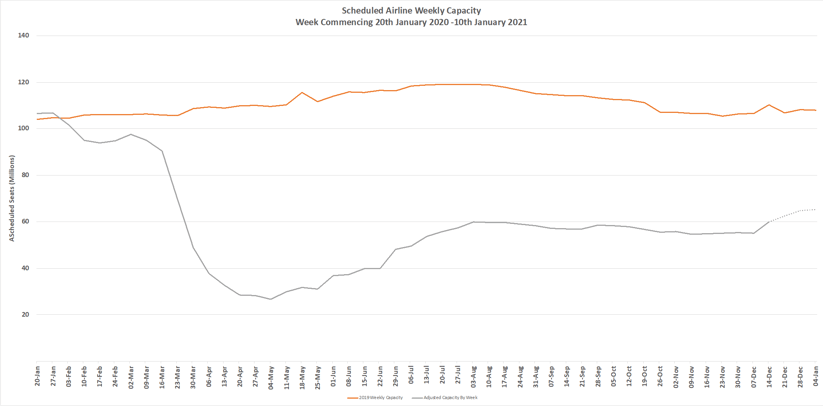
Source: OAG
There has been quite a bit of positive news across the aviation sector in the last seven days. More countries have approved and started immunisation programmes, lockdowns have been at least in the short-term eased and Singapore is once again attempting a travel corridor; this time with Taiwan. Increasing confidence of a recovery in the second half of 2021 is being discussed in many circles although the first quarter of 2021 has the potential to be tougher than my steak this weekend!
Western Europe provides a perfect example of the challenge’s airlines have had and will continue to face in the next three months. Capacity this week is nearly 1.8 million up on last week (+39%) as a result of travel restrictions being eased and yet on Thursday the Canary Islands were again added to the UK travel list just as their peak season was about to start.
The most positive fact is that nine of the top ten global markets are reporting week on week growth and over half of those markets are at double digit levels. Aside from Western Europe, North America and Eastern Europe are reporting strong growth; in North America 1.5 million seats being added highlight show rapidly capacity is being adjusted to meet expected market demand.
Table 1– Scheduled Airline Capacity by Region
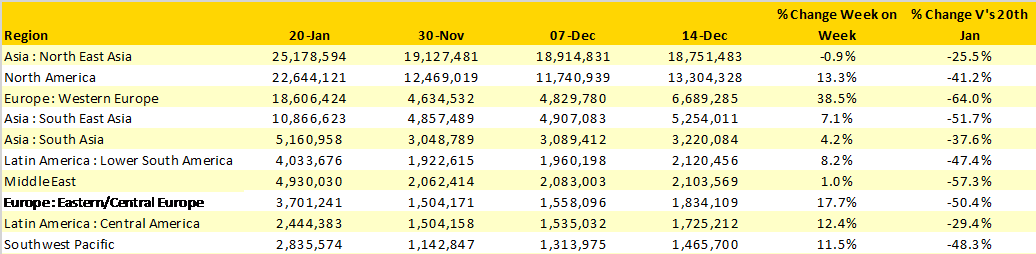
Source: OAG
Despite an incredible near 90% increase in capacity week on week in France, the country remains outside the top ten holding 16th position with markets such as Spain and the United Kingdom leading the European capacity recovery from a volume perspective.
Australia creeps into the top ten ranking in 9th position as a result of the additional 140,000 seats added back with the currently fully reopened for services. Australia’s elevation into the top ten is at the expense of Thailand where capacity has remained static for the last few weeks; if ever a country needed international capacity it would be Thailand with its huge reliance on international tourism; hopefully that will return early in the new year.
Table 2- Scheduled Capacity, Top 20 Countries Markets
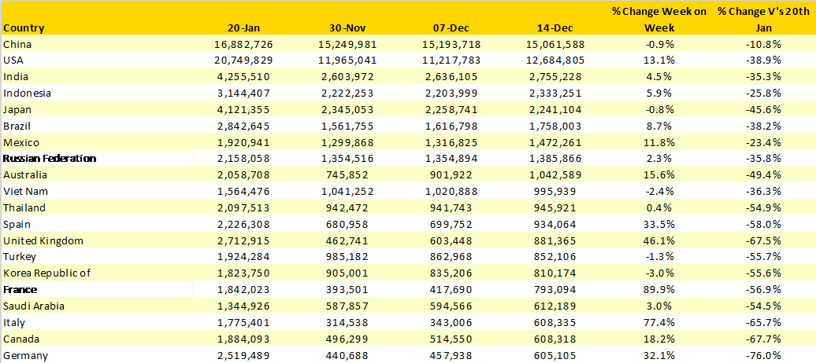
Source: OAG
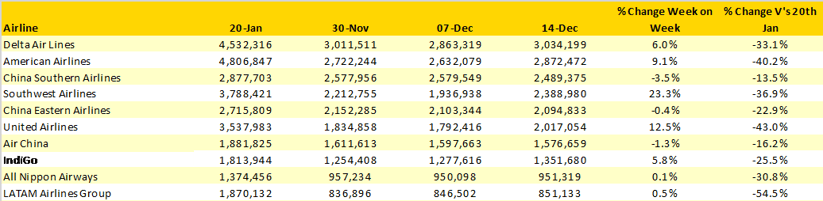
Delta Air Lines must have been aware of American Airlines adding back some 240,000 scheduled seats this week since they also added some 170,000 seats to ensure they maintain the world’s largest scheduled airline. Southwest Airlines have in the past few months adjusted capacity on a week-by-week basis responding to seasonal holidays and subsequent changes in expected demand; a capacity increase of 23% this week just highlights that flexibility.
The top seven placed airlines are either based in China or the United States, something that has not changed throughout the pandemic. The return of Indigo in recent weeks reflects the ongoing recovery in the Indian market and the carrier is now operating around 75% of its January capacity levels making it one of the better placed carriers in the global recovery.
Table 3- Scheduled Capacity Top 10 Airlines
Source: OAG
Last week when capacity had settled around 55 million it felt that there was little scope for growth before the year end, how wrong we were! Demand remains the great unknown for many and the danger remains capacity building too quickly in the hope of demand following. With average fares appearing to be falling as carriers seek to stimulate demand the tightrope of revenue management will be crucial for many; let’s hope those airlines have enough of a safety net in the coming weeks.