

A further 11.1 Million seats were removed from the OAG database this week by scheduled airlines around the globe; equivalent to a 22.7% reduction week on week and the capacity cuts in Europe and North America continue. Weekly capacity is now just above one-third of that originally scheduled for this week and with further cuts being advised by airlines through to the end of May we should expect more capacity cuts next week.
Chart 1 – Scheduled Airline Capacity by Week Compared to Schedules Filed on 20th January 2020
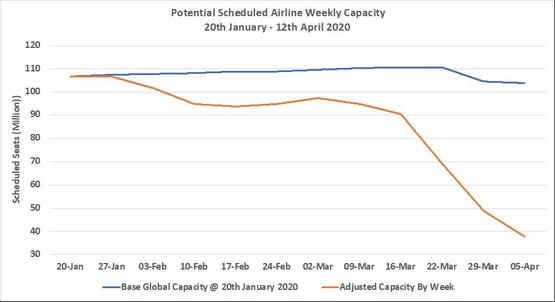
Source: OAG Schedules Analyser
The anticipated cuts in North American capacity that we expected last week are now flowing through into the database resulting in North America no longer being the single largest market losing that particular title to North East Asia. The near one-third reduction in capacity within North America equates to a loss of some five and a half million seats; more than the current total regional capacity on offer in all but North East Asia each week. Two regional markets that fall just outside of the top ten reported; Southwest Pacific and Lower South America both saw nearly half of their scheduled capacity wiped out in one week in response COVID-19.
Table 1 – Scheduled Airline Capacity by Region, 20th Jan – 12th Apr 2020 by Region
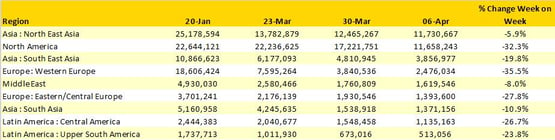
Source: OAG Schedules Analyser
The United States reports a near one-third reduction in capacity but still plans for some 11.2 million scheduled seats to be operated although as we will report later the rate of cancellations amongst the US based airlines has increased rapidly in the last few weeks. The absolute capacity gap between the United States and China, so longer a reference point for the emergent markets of Asia is now 3.1 million seats per week; however, both markets are close to half the size they were some twelve weeks ago.
For the first time no Western European market features in the top ten listing by country as airlines continue to make further cuts in capacity and in some cases suspend operations through to the end of May 2020.
Table 2- Scheduled Airline Capacity, Top Ten Country Markets, 20th Jan – 12th Apr Mar 2020
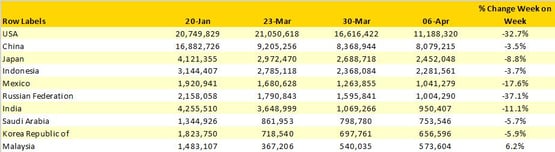
Source: OAG Schedules Analyser
The chart below taken from an OAG On Time Performance Dashboard shows the number of scheduled and cancelled flights from the United States overlaid with data supplied from the European Centre for Disease Prevention and Control. It highlights how both the increasing levels of cancellations being reported by airlines as they refine their schedules and the obvious linkage to reported cases of COVID-19 in the last month. At the peak point on the 27th March, some 45% of all scheduled flights were cancelled and by the end of the week cancellation rates were running just below the 40% mark. If you would like more insights on this data, which is available for most markets and major airlines then just let us know!
Chart 2 – US Scheduled Services Cancellation Rates, 8th March – 2nd April 2020
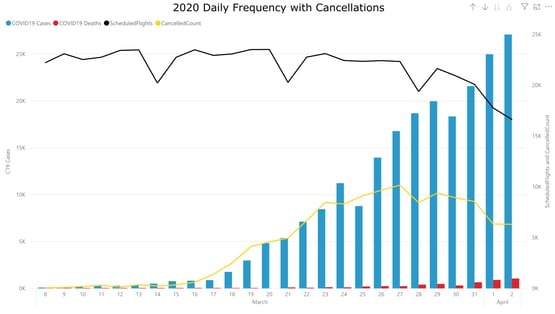
Source: OAG Schedules Analyser
The announcement at the end of last week of further capacity cuts on international services to China is reflected in total scheduled capacity this week falling by some 290,000 of which 131,000 (45%) was from international services. Domestic capacity continues to fall slightly week on week in China as airlines continue to try and balance available capacity against demand; those green shoots of recovery proving difficult to sustain it seems.
Chart 3 –Scheduled International & Domestic Capacity in China, 20th Jan – 12th April 2020
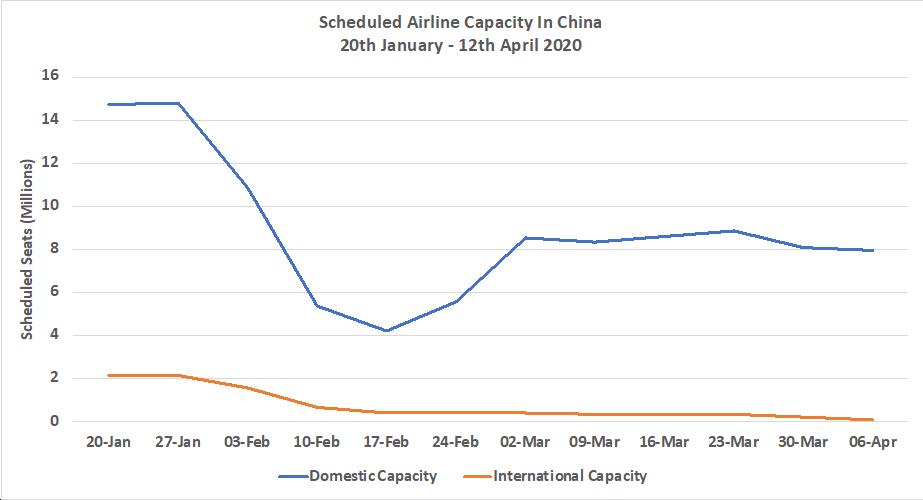
Source: OAG Schedules Analyser
As we noted last week the first of the US majors were filing their schedule adjustments and we expected further during the course of the week. They have in many cases been sent through with American Airlines now joining both United and Delta Air Lines in making dramatic cuts to their operations. We still await advice from Southwest Airlines and expect to see that this week, a combination of those adjustments and already expected changes from other US based airlines could see a further four to five million fewer seats in the North America region.
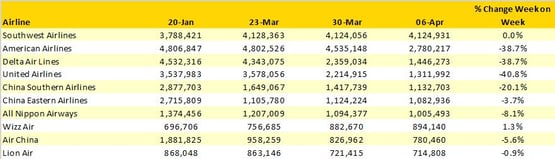
Table 3 – Top Ten Scheduled Airlines 20th Jan – 12th April 2020
The table below shows the absolute change in capacity between the 20th January and this week’s data with Delta Air Lines operating some 3 million fewer seats than twelve weeks earlier. With major airlines from all markets appearing on this list the impact and scale of the capacity lost hits home really hard and the need for Government support compelling if the industry is to recover and contribute so much to the global economy as it has done in the past.
Table 4 - Top Ten Scheduled Airline Capacity Reductions, 20th Jan – 12th April 2020
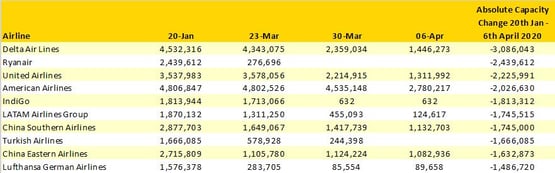
Source: OAG Schedules Analyser
If there is any light at the end of what looks like a very long tunnel, next week’s data may begin to see the weekly capacity reductions bottom out with those hopefully final capacity cuts in North America working their way through the systems. However, with many airlines already having filed their changes through to the end of May it could be that we will have just hit the bottom of a very bumpy road before any real capacity recovery can be seen. Only time will tell.
Plus, in response to demand of last weeks COVID-19 and Air Travel Webinar we are hosting two follow up webinar sessions on Wednesday 8th April. Join our data experts and aviation analysts who will be answering any questions you may have.
Simply register below.