DOT ANALYSER

INSIGHT INTO U.S. AVIATION DATA - SCHEDULES, CONNECTIONS AND AIRLINE PROFITABILITY IN ONE EASY, ACCESSIBLE PORTAL

TRY OUR DATA

OAG-Location-30x30Icon-Yellow

THE U.S. DEPARTMENT OF TRANSPORTATION GATHERS ESSENTIAL DATA ON THE US AVIATION MARKET - THE DOT MODULE MAKES IT ACCESSIBLE
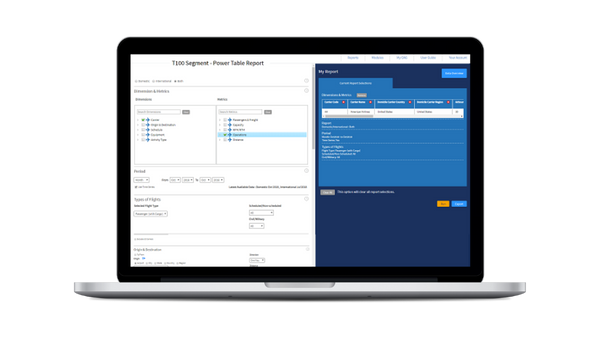


View U.S. airlines’ profitability, passenger load factors, fuel costs and employment statistics in one flexible tool.

Our DOT module combines data from T100, Form41 and O&D (DB1B) reports into one accessible web-based portal. Whether you need to analyze U.S. airline industry trends, make cost comparisons, benchmark financial performance or plan future activity, DOT Analyser will deliver fast and accurate results.


Focus on the right data to deliver the insight, reports and charts you really need to answer questions on the following topics:

Key trends in the U.S. market, U.S. schedules and connections data analysis for route planning and network analysis, competitor capacity and offerings, unique historical DOT insights.


T100 Power Table

T100 POWER TABLE

Analyze T100 Domestic and International data across different dimensions.
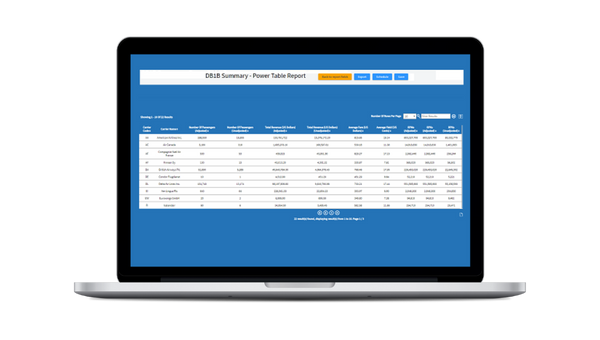
DB1B Power Table

DB1B POWER TABLE

O&D DB1B data to analyze passenger counts, revenues and average fares.
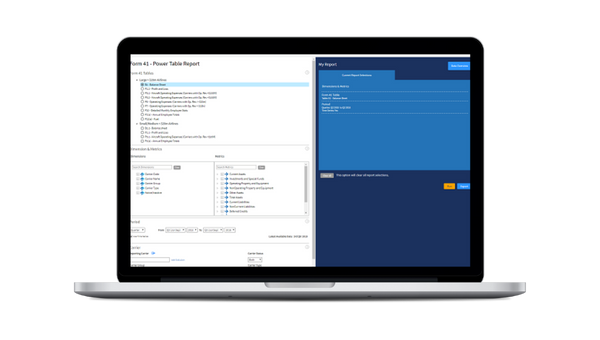
Form 41 Power Table

FORM 41 POWER TABLE

Aggregated Form 41 data with DOT US certified airline schedules data for financial analysis.

LATEST UPDATES


Aviation Market Analysis

In this blog, we explore the size and scale of one of the largest air markets in the world – the Transatlantic - u...

Infographics

If you looked at the calendar today and thought "What happened to Q3?", these infographics are for you! A round up...

Aviation Market Analysis

Megahubs 2025 is the 10th annual edition of the market's definitive ranking of the top internationally connected a...