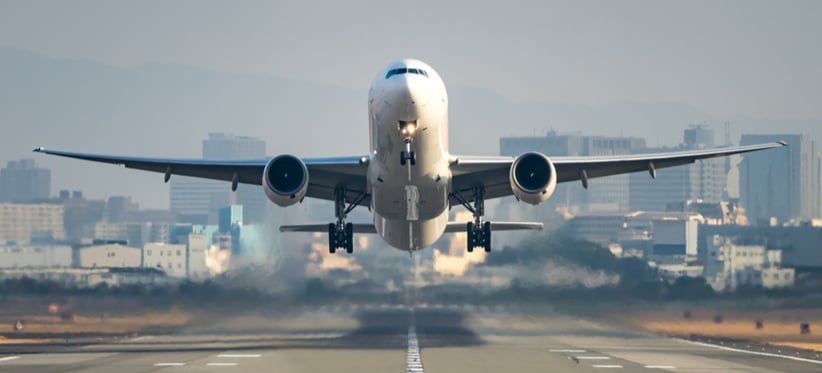
Does Take Off Really Use More Fuel Than Any Other Part of a Flight?
It may be some time since many of us have taken a commercial flight but we don’t forget that feeling of being pushed back into our seat as the pilot put the aircraft into full throttle as the aircraft started to accelerate along the runway. As the plane starts to lift we can believe the engines are working their hardest and burning the most fuel. While take-off may be the most intense point of a flight in terms of fuel consumption, is it right – as some of us have been led to believe – that this uses more fuel than any other part of the flight?
OAG Labs have created a model and database of fuel burn and carbon emissions for flights. The database is now available to customers for their own flight analysis whether that is to provide better ‘labelling’ around flight schedules to help customers with their green travel choices, for ESG (Environment, Social and Governance) analysis, operational efficiency or calculating carbon offsetting requirements.
In this analysis, we use the model to take a look at a selection of flights for a specific day and shed some light on which elements of a flight burn the most fuel.
Cruising Uses Most Aviation Fuel
We looked at a selection of 10 flights on a single day, 28th January 2022, all departing from London Heathrow Airport (LHR) to a range of destinations, using different aircraft, operated by different airlines and of varying flight lengths. The shortest flight was the Air France flight to Paris Charles de Gaulle Airport (CDG) on an A319 aircraft, a flight of just 348km and scheduled to take one hour and 20 minutes from gate to gate. The longest flight was the Cathay Pacific flight to Hong Kong (HKG) using an Airbus A350, a flight of 12 hours and 5,500km.
The other flights were to Athens (ATH), Dubai (DXB), Edinburgh (EDI), Geneva (GVA), Helsinki (HEL), Lisbon (LIS), Madrid (MAD) and New York (JFK).
The model breaks the fuel burn down into six flight stages: taxi out, take-off, climb, cruise, approach and taxi in. It’s clear that the shorter the flight the more, proportionately, that the non-cruising elements of the flight contribute to total fuel use but there’s no escaping the fact that on every flight, whatever distance, the fuel used to take off is a relatively small fraction of the total fuel use.
Aircraft Fuel Consumption Charts
|
|
|
For the longest flight, to Hong Kong, cruising uses up 96% of the total fuel burned. For the flight to Dubai it’s almost as much, with 95% of fuel burn going on simply cruising. At the other end of the scale, cruising accounts for just 62% of the overall fuel burn for the flight to Paris, and 68% for the flight to Edinburgh.
There is obviously more to aircraft fuel consumption than simply the length of a flight, as the chart above shows. Among the flights analysed, it’s the Dubai flight – not the longest flight to Hong Kong - that burns the most fuel. The reason is the Dubai flight is operated with an A380 which, weighing in with a Maximum Take-Off Weight (MTOW) of 575 tonnes, is significantly heavier than the Boeing 777 to JFK and maybe twice as heavy as the Airbus A350 to HKG. Of course, it also carries more the most passengers., which explains why Airbus A380 has the highest fuel consumption per hour
Carbon Emissions by Flight Stage
Flight carbon emissions in the form of CO2 from burning fossil fuels are proportional to the quantity of fuel burned. Inevitably, therefore, the longer the flight the more carbon emissions there are. While cruising accounts for the majority of carbon emissions on every flight, and so longer flights produce more CO2, the contribution of taxiing, take off, climb, approach and taxi in are not insignificant for short haul flights.
What About Aircraft Fuel Efficiency?
Total fuel burned is an important metric, but so too are those around efficiency. Aircraft capacity, age and engine type all contribute significantly to relative fuel burn. In our example, the A380 used to fly to Dubai uses almost 14 litres of fuel per kilometer flown while the newer A350 to Hong Kong uses just 6.0, less than the A319 to Paris.
Meanwhile the A321neo, one of the newest aircraft, uses an average of 2.7 litres of fuel per kilometer.
|
|
|
Fuel burn per kilometer doesn’t in itself reflect the relative aircraft size and the capacity of an aircraft. This is where those with more seats, such as the A380, can come into their own.

Taxi, Please!
The fuel burn data shows that anywhere between 2% and 17% of fuel burn goes to taxi out or taxi in activities, with taxiing accounting for proportionately more fuel burn on the shortest flights. It’s no wonder that many airlines and airports use tugs to move aircraft around rather than unnecessarily burning kerosene while still on the ground. Increasingly aircraft have electric motors fitted which mean that they can use ground-based sources of power for these on-airport movements.
As OAG has shown in its latest airline punctuality data, the global pandemic has had the effect of improving airline on-time performance. Fewer flights have led to less busy airports and more flights able to depart on time. But what happens when airports start to get busy again? Will we see flight delays increase? Delays on the ground often mean more time that aircraft spend taxiing and sitting idle on a taxiway with the engines ticking over. If the fuel use associated with taxi-out for our Paris flight doubled, then taxiing would increase from 17% to 25% of total fuel use.
Avoiding using aviation fuel for taxiing comes with many benefits, not least of which is cost, but also health and safety of workers on the ground as well as engine wear and tear. And this is one area of carbon emissions that should be more straightforward to reduce.
Recommended:



.jpg)



.png)


