Africa's Aviation Market
Monthly Airline Data Updates for the African Market
Discover the Busiest Airports and Airlines in Africa This Month | February 2026
How much airline capacity is there in Africa? Find out with new data each month.
Here are some of the key stats from this month's African aviation market update:
- Busiest airport: Cairo International
- Biggest airline in Africa: Ethiopian Airlines
- African country with most global airline capacity: Egypt
- Country with most domestic airline capacity: South Africa
Top Ten Airlines in Africa (Departing seats, one-way) | February 2026
Which is the biggest airline in Africa?
- Ethiopian Airlines remains Africa's largest carrier, operating 1.8m seats in Feb 26, an increase of 5.4%, 91,900 more seats.
- Within the Top 10, South African Airways grew again at the fastest rate of 28.6%, followed by Royal Air Maroc at 18.4% vs last year.
- Demand in South Africa is growing again and SAA is rebuilding and expanding following its restructure and business rescue.
- Air Cairo moved into 10th largest airline, with an increase in capacity of 5%.
Top Ten Busiest Airports by Departing Seats in Africa | February 2026
Which is the Busiest Airport in Africa?
- Cairo remains the largest airport in the continent with 1.6m seats in Feb 26, an increase of 12.1%.
- Fastest growth within the Top 10 largest airports in Africa came from the two Moroccan airports and Cape Town:
Casablanca (+13.1%), Cape Town (+12.4%) and Marrakech (+11.1% vs Feb 25).
Airline Capacity in Africa | February 2026
How much airline capacity is there in Africa This Month?
- Total capacity across Africa this month has increased by 8% vs Feb 25 to 22.3m seats.
- International capacity represents 77% of total capacity and is up by 7.7% vs Feb 25.
- Domestic capacity increased by 9.3%.
- Mainline carriers represent 79% of the market and capacity increased by 7.9% vs Feb 25.
- LCCs grew at a slightly faster rate of 8.5% vs last year to 4.7m seats.
WE'LL LET YOU KNOW WHEN NEW DATA IS ADDED
Add your name to the list and we'll email you once a week with a round-up of the new aviation data added to our dashboards, the latest in-depth analysis from our air travel experts, travel technology news, easy to digest infographics and more.
African Countries' Airline Capacity | February 2026
Which African Country Has The Most Airline Capacity (Domestic + International)?
- Egypt remains the largest country market in Africa with 2.8m seats in Feb 26, an increase of 13.4% vs last year.
- Capacity in South Africa also grew by 13.4% vs last year to 2.3m seats in Feb 26, an additional 271,900 seats.
- Within the Top 10 countries, capacity grew at the fastest rate in Tanzania, with an uplift of 15.8% vs Feb 25.
Which African Country Has THE Most DOMESTIC Airline Capacity?
- South Africa remains the largest Domestic market in Africa, with 1.6m seats this month, an increase of 16.9% vs last year.
- Domestic capacity grew at the fastest rate in Algeria, followed by Tanzania, increasing by 20.7% and 18.8% respectively.
- Capacity in Congo continues to contract by 29.3%, 37,500 fewer seats.
Airline Capacity By African Region | February 2026
Where do flights from Africa go?
- Capacity to Europe remains the largest International destination region, with 8.3m seats (605,600 additional seats vs Feb 25).
- Capacity grew by 439,500 seats to the Middle East vs last year.
- The Middle East is the second largest market with 4.3m seats.
Which Region of Africa Has Most AIRLINE Capacity?
- Capacity to/from North Africa is the largest market with 6.1m seats, growing by 506,500 seats vs last year.
- Capacity to/from Western Europe is the second largest market with 3.9m seats, growing by 233,000 seats vs last year.
- Capacity to/from Eastern/Central Europe grew at the fastest rate of 32.5% vs Feb 25, followed by North East Asia (21.5%) and Southern Africa (12.5% vs last year).
MORE RESOURCES FROM OAG
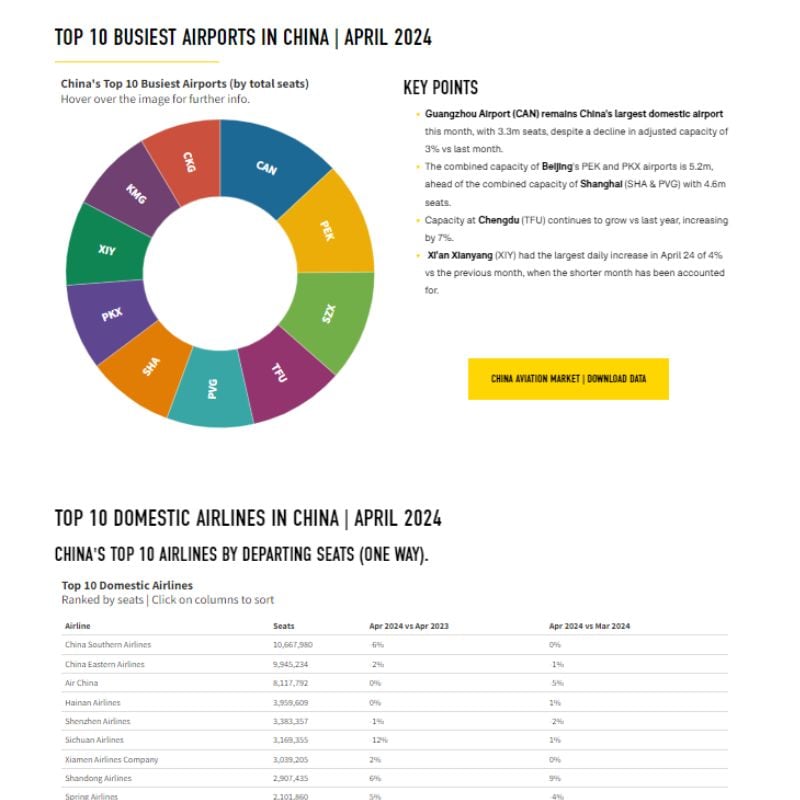
China Aviation market Data
The busiest airports, largest airlines, biggest cities for airline capacity and more
View Data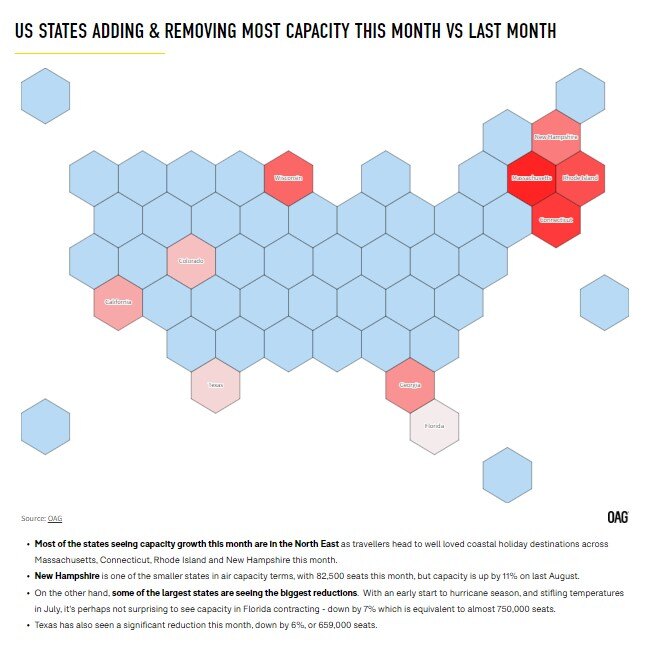
US Aviation Market Data
This month's leading airlines, airports, states and more from the US market.
View Data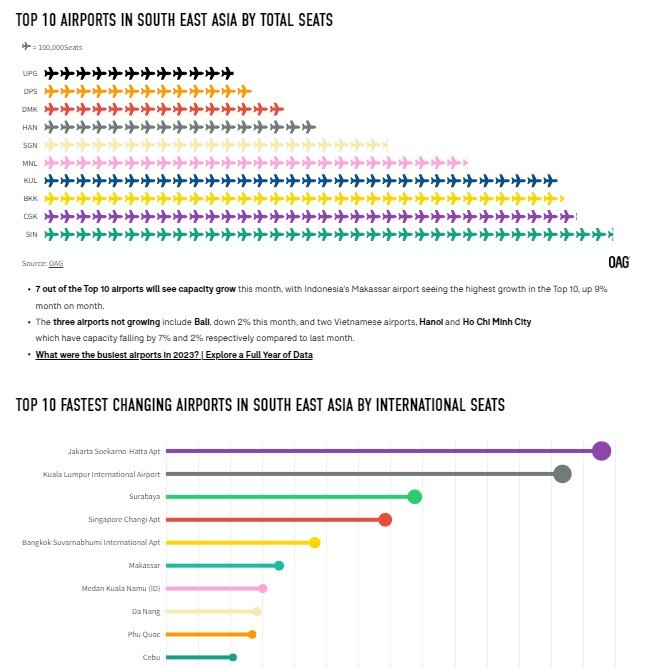
South East Asian Aviation Market Data
SE Asia's biggest country markets, airports, airlines and more are updated each month.
View Data


Aviation Market Analysis
Analysis of the latest data and developments in the aviation world.
Read Now



.jpg)


.png)


