


In some countries the number 111 is believed to bring bad luck. In cricket it is called a “Triple Nelson”, feared by Australian cricketers more than an English bowling attack, but we might just be at the moment when after 111 days from the 20th January that we begin to see some modest capacity growth at a global level.
The latest data shows a two percent increase in weekly capacity with some 29.8 million scheduled seats this week representing a small but very important 600,000 more than the previous week with pockets of growth occurring in eight of the seventeen regional markets analysed. Total capacity is now at 29.9 million seats; some 80 million fewer seats than operated in the same week last year which highlights how far the global market has been impacted.
Interestingly, this time last week the forward-looking capacity suggested that some 32.3 million seats would be operated this week, that fell back by some 8% as airlines continue to make last minute adjustments to their schedules with less than a week’s notice. The forward looking capacity for next week now stands at 42.3 million; very close to the number reported a week earlier; it is very likely that whilst we make breakthrough the 30-million-mark next week, 42 million would be a step too far.
Chart 1 – Scheduled Airline Capacity by Week Compared to Schedules Filed on 20th January 2020 & Previous Year
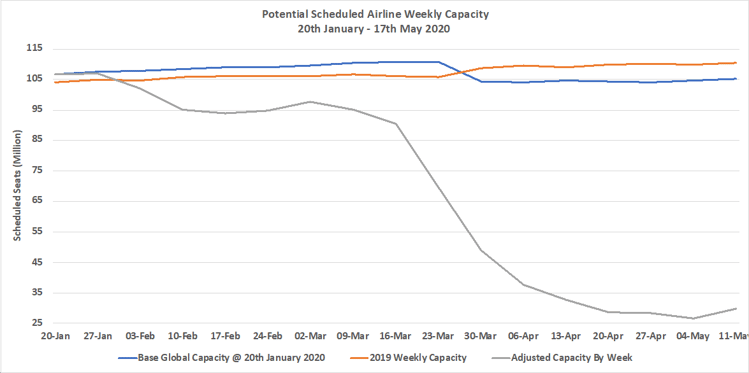
Source: OAG
For some weeks North-East Asia has been showing signs of some recovery in capacity, driven of course by the growth in Chinese capacity where a further one million domestic seats were added back this week to the schedules. Hong Kong was another market to report some positive news with Cathay Pacific adding back some 40,000 seats and growing frequency by some 120 flights over the seven days; at around eight round trip flights a day hardly earth shattering but nevertheless a positive step.
Similarly, from a small base, there are signs of recovery in South America, the North and South regions reporting double digit capacity growth on the previous week. Indeed, only one region, South Asia reports a double-digit decline amongst the top ten global regions and even here a potential reopening of domestic services in India before the 15th May could see capacity bounce back next week.
Table 1 – Scheduled Airline Capacity by Region
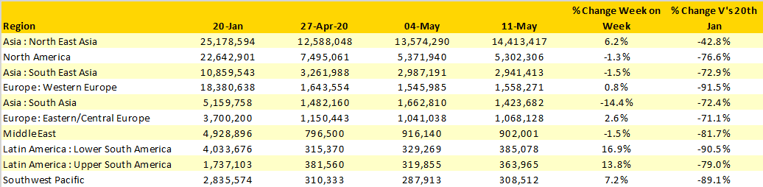
Source: OAG
As a result of some 800,000 additional domestic seats being added in China the domestic share of global capacity has now crept up to 85% highlighting both the importance of air services in some markets and also where we should expect to see the initial signs of recovery. China’s domestic capacity stands at 75% of January’s level, the United States at 27% and Russia at 49% of pre COVID-19 levels; for anyone interested the UK level is now some 4%!
Chart 2 – Domestic & International Capacity Splits, All Markets
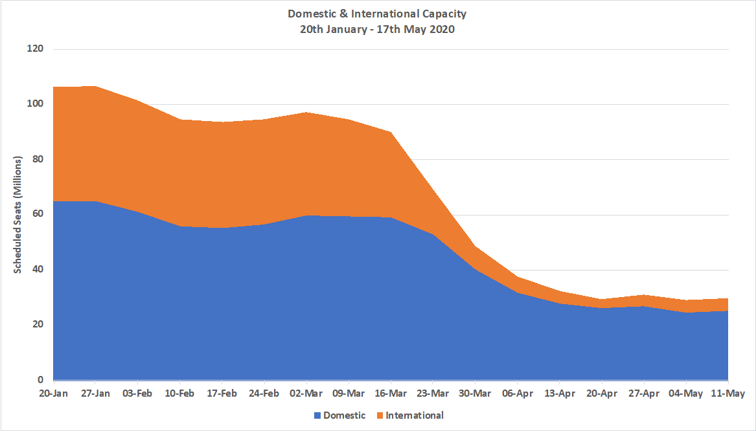
Source: OAG
The top ten country market table continues to combine a mix of the regular candidates with some traditionally smaller countries where capacity has been maintained or some signs of recovery are underway. China continues to “bask” in number one position ahead of the United States operating twice as many seats as they continue to trump their competitor. The top five country markets are actually the same this week as reported on the 20th January although not one of them is in the same position.
Vietnam was in 19th position seventeen weeks ago and the Philippines in 23rd place. The absence of any Western European country in the top ten global markets illustrates how damaging COVID-19 has been with the United Kingdom (now 13th), Germany (now 15th) and Spain now 23rd just as the traditional summer season begins to build.
Table 2- Scheduled Capacity, Top 10 Country Markets
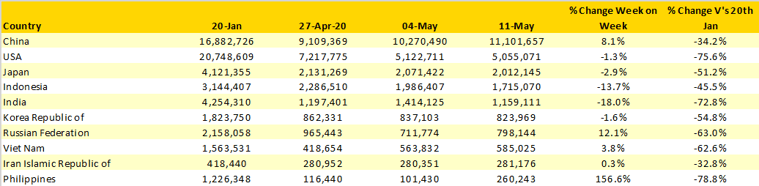
Source: OAG
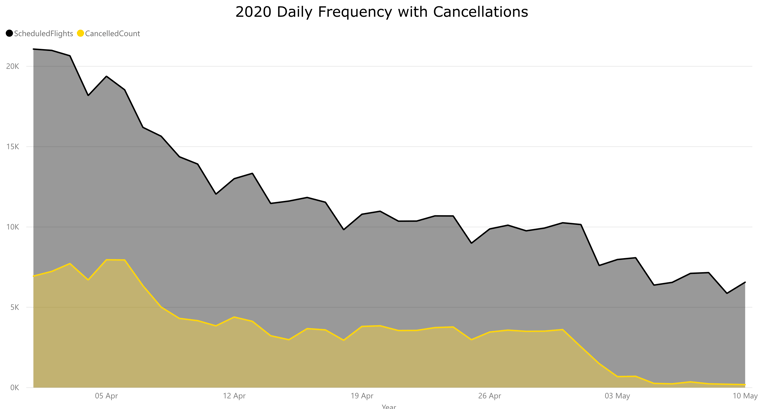
In the last six weeks we have highlighted the extremely high levels of cancellations in the US domestic market as airlines continued to schedule services and then actively cancel at the last minute as demand evaporated. The last two weeks have seen all of the major US airlines reduce the number of scheduled domestic flights, as some 16,250 flights have been “unscheduled” over the last two weeks which is around a 25% cut. Reassuringly, the level of cancellations has correspondingly dropped to 9% since the beginning of May and in the last five days to just below 4%, still slightly higher than normal operational levels but much improved on recent times. In this instance, fewer is better, at least from an operational perspective.
Chart 3 – US Scheduled Domestic Capacity and Cancellations, 1st April – 10th May 2020
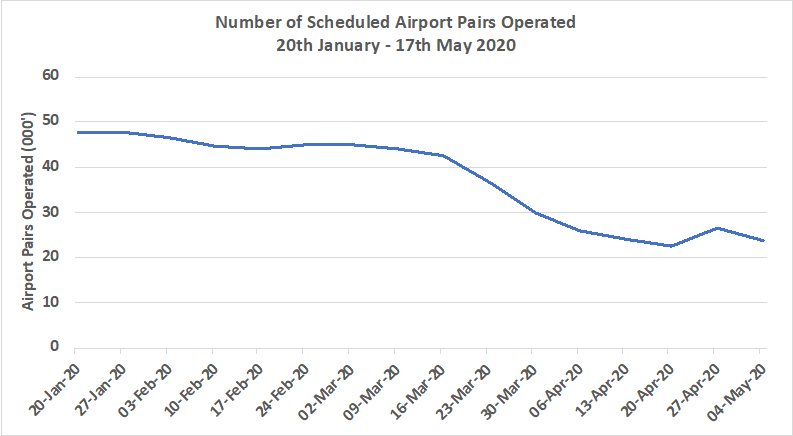
Aviation has, in the last twenty years, created amazing connectivity across the globe, in many cases allowing one-stop connectivity to almost any location and bring increased trade and tourism with that connectivity. Its importance cannot be underestimated which might well explain the levels of support that many Governments are making today to even the most failing of carriers. At the end of January there were some 24,400 airport pairs operated at least once weekly; that is now down to just above 13,000 as airlines suspend networks and retrench back to the core networks established over many years.
The busiest route in the world seventeen weeks ago is still the busiest route, Seoul Gimpo to Jeju for anyone planning a holiday; whilst Melbourne – Sydney once at one thousand flights a week is now down to 38 weekly services. But perhaps more importantly it is those markets served perhaps daily that are no longer operated where the greatest damage has occurred to the economy, routes such as Istanbul – Kigali where for Kigali access to the world has just been made a lot harder because of COVID-19.
Chart 4 – Number of Scheduled Airport Pairs Operated
As we have always said, capacity is but one half of the equation and increasingly the discussion is turning to the recovery in demand. Quite how that will shape up is anyone’s guess with so many variables at play. A new analytical tool from OAG released last week will show some of the patterns in the coming weeks and we will include some highlights (a relative phrase!) in the coming weeks as confidence rebuilds and lockdowns ease.
The last seventeen weeks have been horrid; weekly updates in which capacity has been cut further and further do not make a great start to the week and the subsequent impact across the industry devastating. We might just be at the point of a Triple Nelson knocking COVID-19 for six but the damage to the industry will sadly be around for some time yet.