
This week we are going to take a look at total airline capacity across the years. This seems fitting as we near the year-end and those “what happened in…” quizzes begin to appear, and the TV becomes flooded with romcom movies rather than Messi vs Mbappe analysis - what a final they delivered yesterday!
Aviation Continues Its Steady Recovery but Still Has Further To Go
Scheduled airline capacity changes very little at this time of year, partly due to everyone being at an office party or taking unused leave, and also because schedules have been firmly fixed for some months. This week there are 94.7 million seats planned (0.1% more than last week). However, it is likely that weather disruption will impact activity in North America and the inevitable Covid-19 surge post China’s easing of restrictions will see cancellations increase - just in time for the holiday season!
Planners are now clearly focussed on the first quarter of 2023, and optimistically have been adding four million more seats - which amounts to a massive 0.3% increase - it doesn’t even nudge the needle, but every little bit helps at this time of year.

Can anyone remember the number of scheduled seats operated in 2017 or 1996? Well, we can! The answer for 2017 is 5.2 billion, and for those interested in 1996 it was 2.6 billion. By the end of 2022 we will be at 4.7 billion scheduled seats as we forecasted some weeks back, how lucky were we in that forecast!
Tracking the Travel Recovery - Airline Capacity 2019-2022
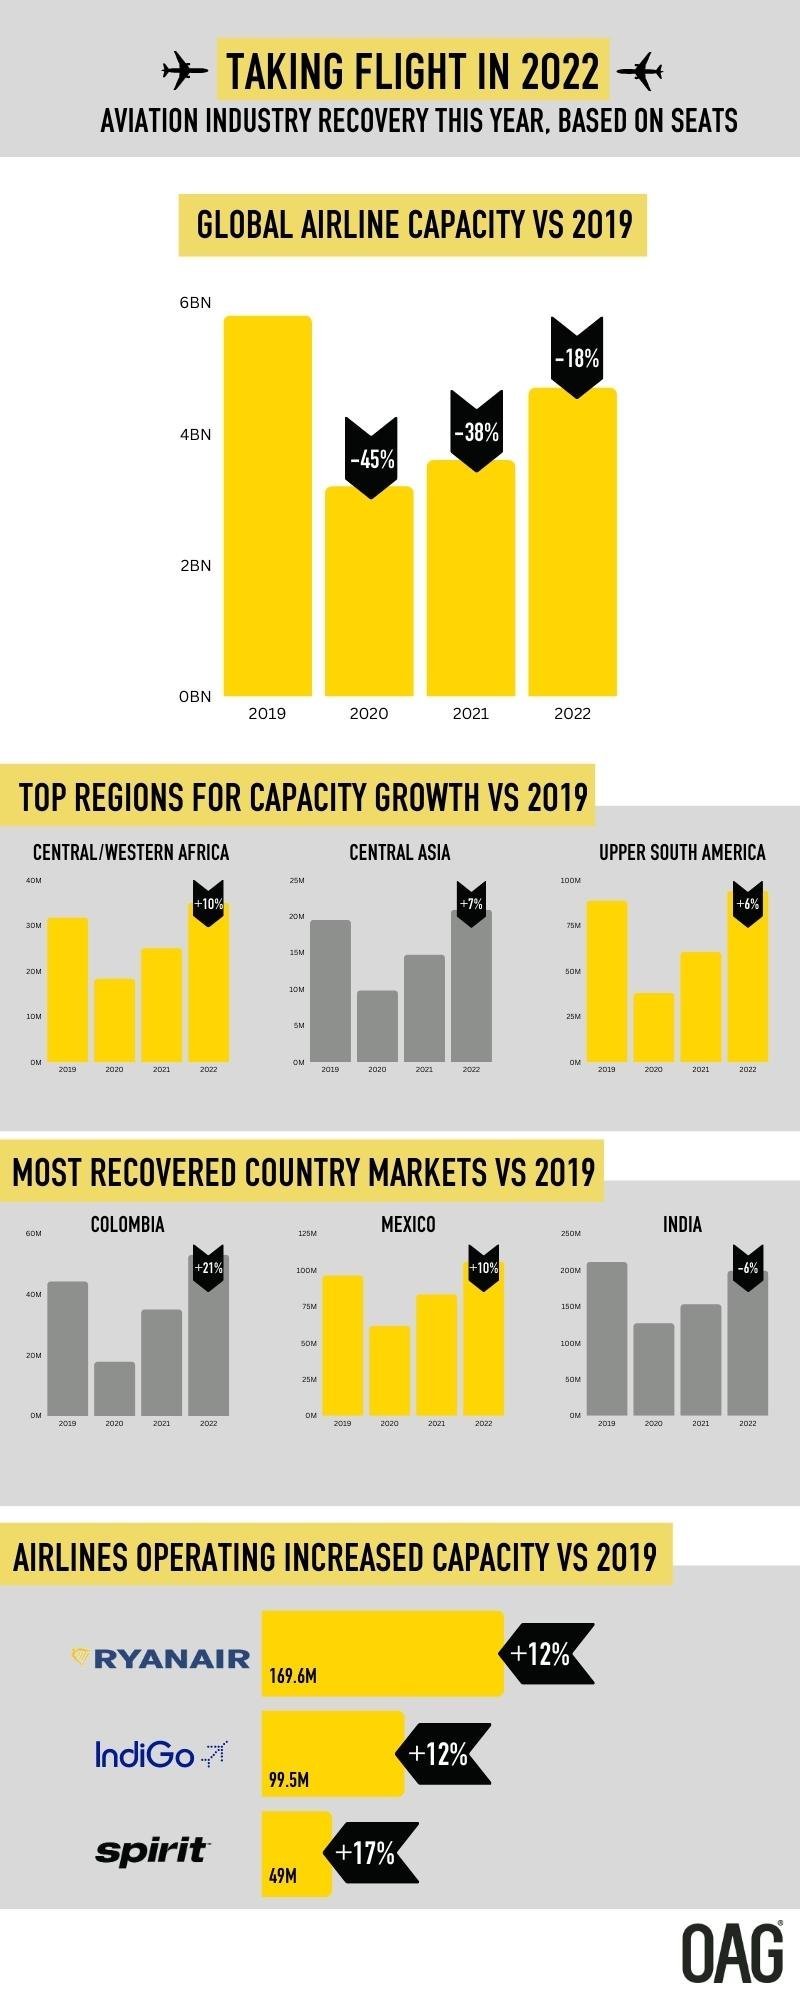
Taking the positives first, global capacity has bounced back by over 30% compared to 2021 and by nearly 50% when compared to 2020 (although we all probably want to forget that year). We are however still on a per annum basis around 18% below the 2019 level and despite the second half of the year reporting a stronger performance with around a 13-15% shortfall, catching up any further after the first quarter of the year was a challenge.
There are three “hot spots” for capacity growth against 2019:
- Upper South America (+6%)
- Western/Central Africa (+10%)
- Central Asia (+7%)
Combinations of large low-cost growth, new airlines and legacy carrier network expansion have improved the performance in many of those country markets. Unfortunately for each of those “hot spots” there are some regions of the world still struggling, and just to add to their problems they all seem to have interdependencies on each other; North East and South East Asia are both linked by one outstanding issue, China and international access. However, if China was to reopen at any point in 2023 for international services there is an issue of available fleet resources in many airlines that would need to be solved - and that’s before the issue of overflying some major pieces of land which will need addressing for Europe’s legacy airlines.
1 Billion Scheduled Seats in 2022 for the United States
Looking at the top twenty country markets not surprisingly the United States leads the chart with just over 1 billion seats this year, a staggering 56% up on 2021 capacity although still 7% below the 2019 high tide mark. There are in total five country markets that are within touching distance of their 2019 capacity, the closest is India at -5.7% and the market certainly has room for further recovery with new aircraft orders being placed and a resurgent low-cost sector growing demand (although several operational challenges remain around aircraft spare parts and resources).
The speed of recovery from the pandemic has been quite remarkable when comparing year-on-year capacity. Over half of the top twenty countries have seen a capacity recovery of more than 50% compared to 2021 and two markets - the United Kingdom and Canada - have seen over 100% increases. Against that backdrop, the operational challenges faced by the industry throughout the year are perhaps not as surprising as the press seemed to sensationalise - finding twice as many fully qualified staff at short notice would be a challenge for any industry, not just aviation.
The four largest airlines in the world (measured by capacity) are all based in the United States. American Airlines is now 18% larger than second-placed Delta Air Lines which in turn holds less than a one percent advantage over the world’s largest low-cost carrier Southwest Airlines.
Within the top twenty airlines are three carriers that are now operating more capacity than in 2019:
- Ryanair (+12%)
- Indigo (+12%)
- Spirit Airlines (+17%)
All three of those carriers are low-cost operators and it is no surprise that globally 32.7% of capacity comes from this sector compared to 30.1% in 2019; it doesn’t seem significant, but it represents a large step forward against the legacy carriers.
2022 was certainly an interesting year for the aviation industry with plenty of optimism around the recovery process and, in many cases, airlines reporting record third-quarter revenues (although many failed to note that their costs were at record levels as well). There are many challenges to be faced in 2023, including increased operating costs, concerns around consumer confidence and (despite the best attempts of many) the return of the corporate traveller. However, there is equally growing confidence in the travel recovery with airlines placing new aircraft orders, new routes being announced and great things happening in both the short-haul and long-haul markets. Will 2023 be as exciting as this year? Probably, and at the very least every year provides great data, insights and stories that we will continue to bring via weekly updates, blogs and webinars (remember to sign up for instant notifications).
In the meantime, have a happy holiday season wherever you are and if you see a man in a red jacket in the skies on Saturday, hopefully he is operating on time and will drop by en-route!
And finally, did I mention that Brighton has a world cup winner in their team... who would have imagined that at the beginning of 2022!
Stay safe everyone.
The data in the charts and tables is available to download here.
Here is a quick overview of the data detailed in the article: