
How differences in route market share translate to yield differences for America’s low-cost carriers
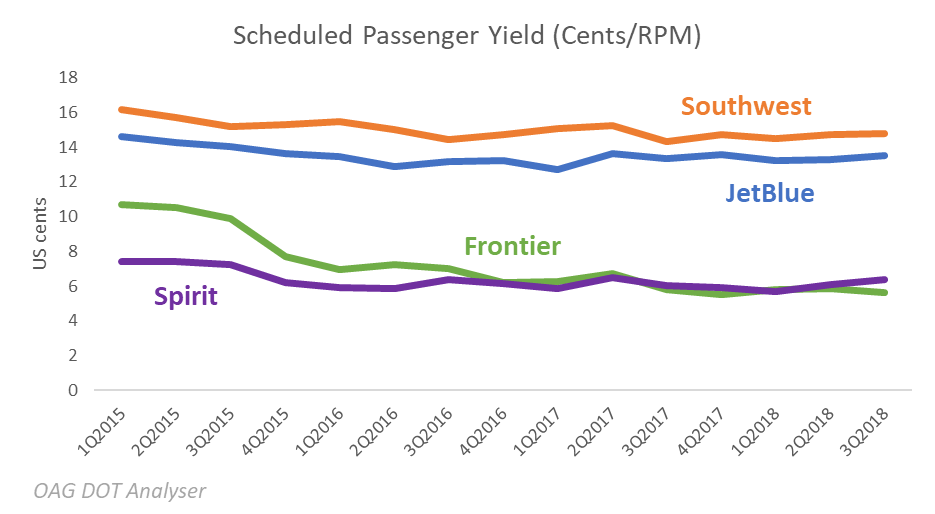
In January 2019, Southwest provided the second largest volume of scheduled capacity among US carriers, at least as measured by the number of airline seats in the market. Southwest Airlines has made a name for itself as one of the original disruptive businesses, and its success has spawned no end of copy-cat airline business models. Today, the airline still leads the way for scheduled low-cost passenger yield among, as reported by the US Department of Transport, with clear water between yields at Southwest and at its nearest rival among the big US LCCs, JetBlue – although the DOT figures shown here are just aeronautical revenues, without the contribution from ancillary revenues.
OAG has compared Southwest Airlines with JetBlue, Spirit Airlines and Frontier, the four dominant LCC’s in the US. From a network perspective, each have a different strategy. While Southwest has concentrated on the domestic market, with a comprehensive network made up of almost 750 routes which criss-crosses the country, JetBlue is much more focussed on the Eastern Seaboard; while it operates transcontinental services, its network strength is in operating up and down the coast and providing access to the Caribbean.
If any two of these four had the most similarity in terms of networks, it would be Spirit and JetBlue, although the Spirit network fans out from Florida while the JetBlue network has more of a North East focus.
Frontier seems to have taken a hybrid approach with widespread coverage of the domestic market but few key network centres.
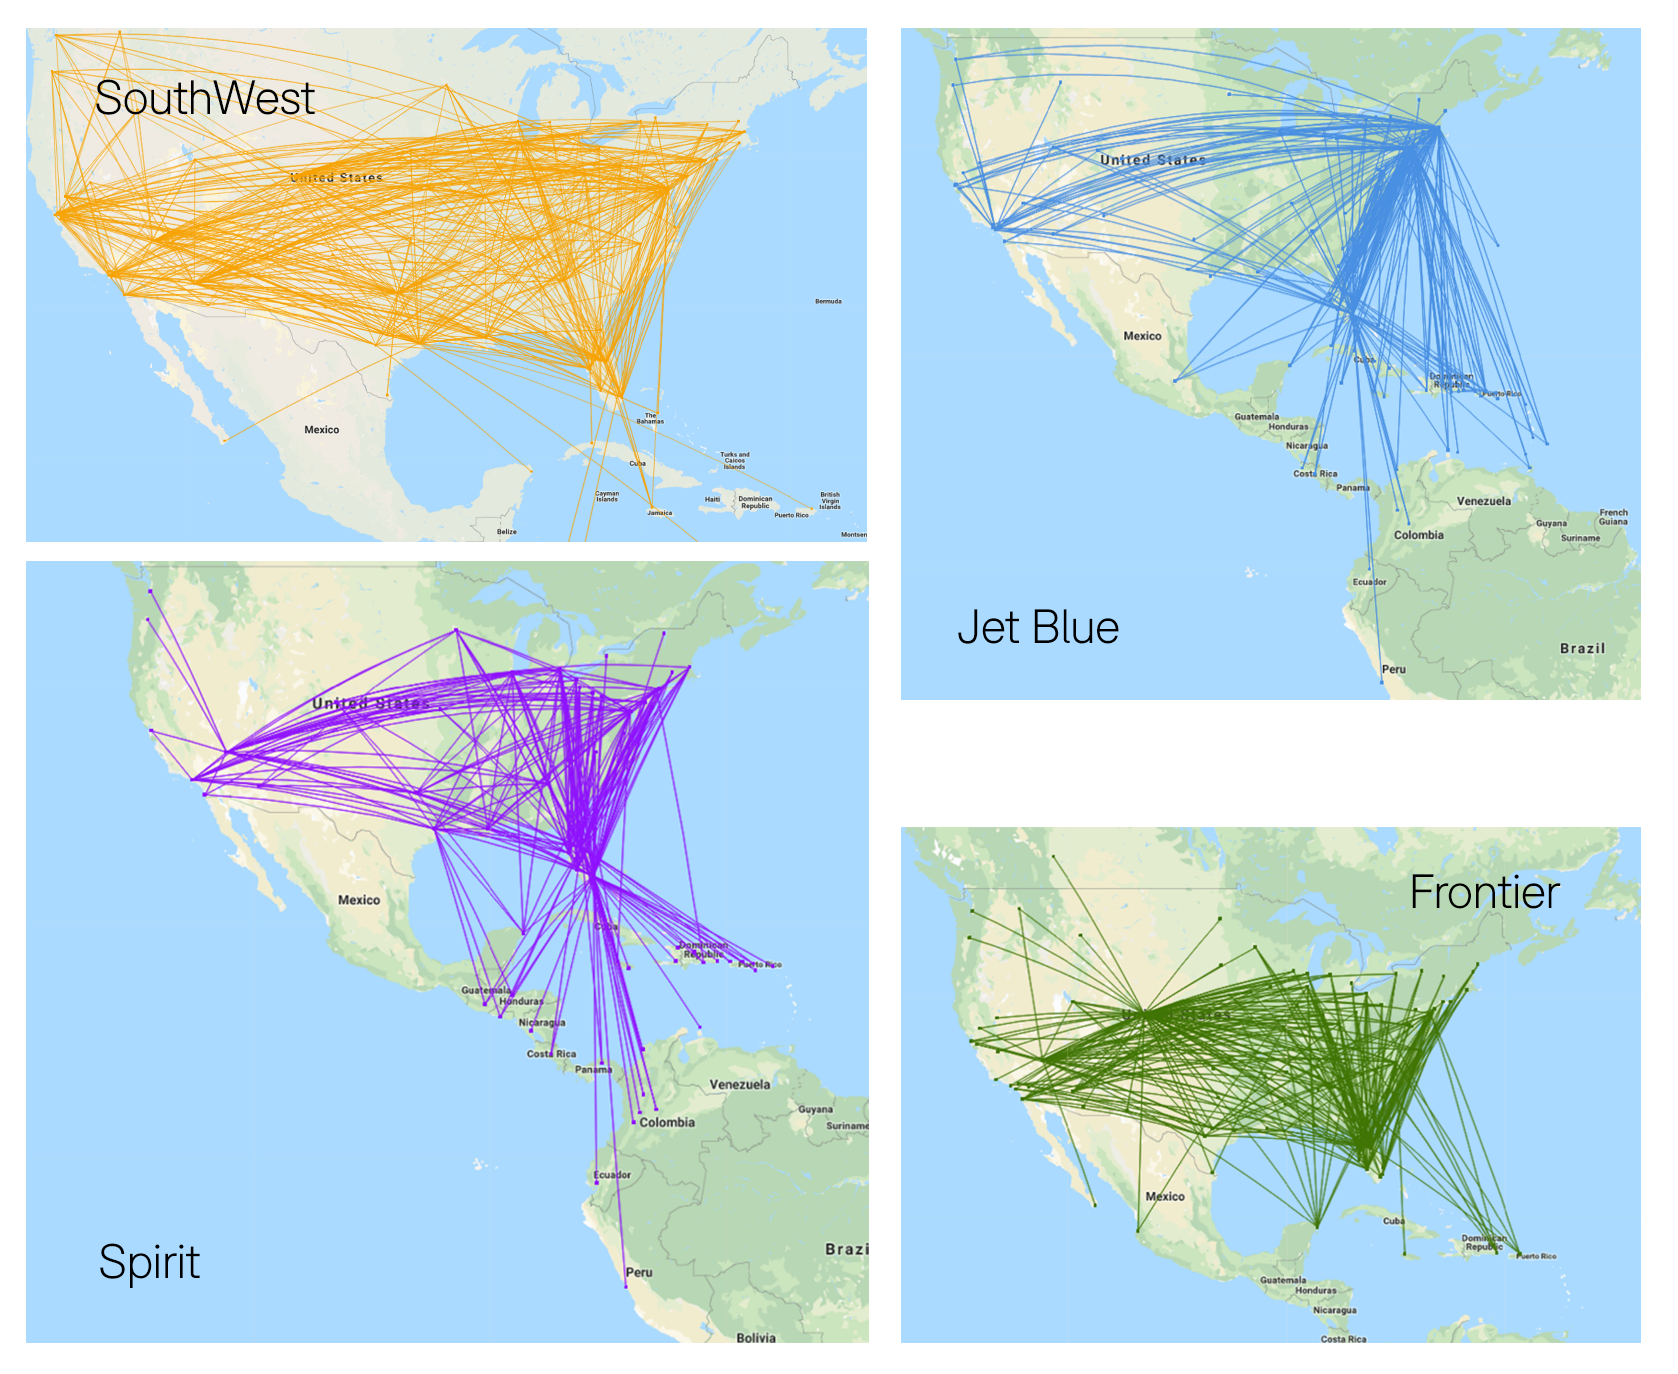
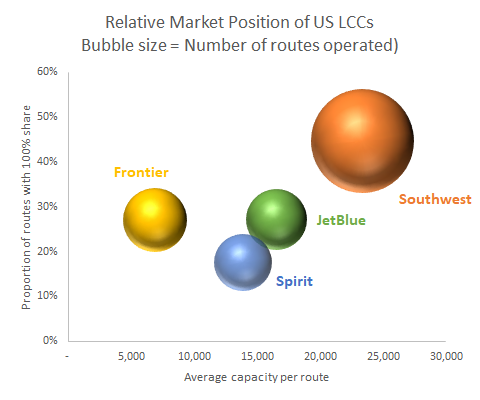
What the network maps don’t show is the difference in competition which each carrier faces on each of its chosen routes and this is where more significant differences become apparent. Southwest is clearly the largest of the four with almost as many routes as the other three main LCCs together. More to the point, it operates much more capacity, on average, per route than the others. In January this year, Southwest routes averaged over 23,000 seats, just 16,500 at JetBlue and fewer at Spirit and Frontier.
|
US Low-Cost Carriers’ Route Statistics January 2019 |
||||
|
|
Southwest |
JetBlueB6 |
Spirit |
Frontier |
|
Average capacity per route |
23,367 |
16,499 |
13,871 |
6,874 |
|
Average capacity share per route |
71.3% |
57.9% |
38.1% |
45.0% |
|
Proportion of routes with 100% share |
41% |
27% |
18% |
27% |
|
Number of routes |
743 |
258 |
227 |
281 |
More startling, perhaps, is the sheer proportion of routes where Southwest is the only airline flying the route, operating 100% of capacity. Forty-one percent of Southwest routes face no competition from another operator, let alone a low-cost carrier. Across the network, the average capacity share on a Southwest route is 71%. This is a model OAG has observed elsewhere. Azul, the Brazilian low-cost carrier, also boasts a remarkably high proportion of routes where it dominates as the sole operator.
When viewed against its peers, it’s surprising that there hasn’t been more made of this key link between choice of route to operate and the impact of market domination on yields. Undoubtedly this has been a factor in their position as one of America’s largest airlines and has secured their place in the market.