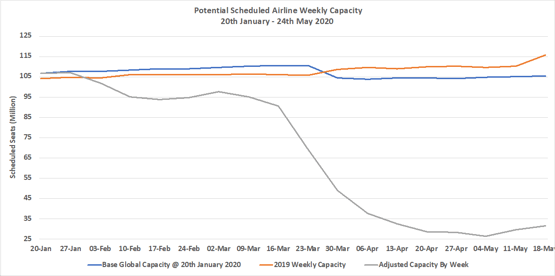
Its been a record breaking positive week for weekly capacity growth; we have broken through the 30 million weekly seat mark! That remains some 83 million seats below the same week last year or a “modest” 73% lower but with two weeks of consistent growth the numbers are at last growing; it must be spring!
One of the positives that we will see is “record breaking” weekly numbers. For instance, this week capacity has increased globally by some 6%; that will not I suspect have happened before. Meanwhile, USA TSA Checkpoint data reflects a 46% increase in activity in the last two weeks; 250,000 travellers were processed on the 15th May compared to 171,000 on the 1st May. Look hard enough and there are positives in the data and its good to see….at last.
Chart 1 – Scheduled Airline Capacity by Week Compared to Schedules Filed on 20th January 2020 & Previous Year

Source: OAG
At a regional market level capacity in South Asia has doubled week on week with some 1.7 million additional seats added back for sale or perhaps at least scheduled to operate. The reopening of the Indian domestic market accounts almost all of that recovery and as we have seen across other markets and specific airlines such capacity growth often leads to very high levels of cancellation in the first weeks of service. Both Bangladesh and Pakistan are also showing signs of recovery and although off of smaller base figures they are positive indicators for those markets.
In total seven of the top global regions have some level of growth over the previous week; ironically North East Asia which has been the one spot of optimism for the last few months has a slight week on week decline with Chinese domestic capacity declining slightly post the early May public holiday, but certainly nothing significant.
The respective pace of the COVID-19 event is also reflected in a further 22% reduction in weekly capacity in Lower South America. It is important to remember that every region of the world is at a different stage in the “event” and no two markets are likely to enter or recover from the event in the same way. Argentina for instance has 100,000 fewer domestic seats this week whilst neighbouring Brazil has a very slight increase.
Table 1 – Scheduled Airline Capacity by Region

Source: OAG
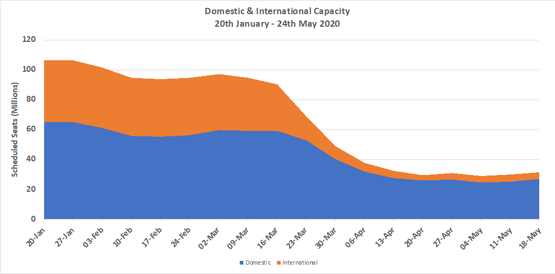
Domestic market capacity continues to account for over 85% of all seats operated and clearly markets such as China, the United States and the welcome return of the Indian market are major factors in such a large share. The last week has also seen a return of capacity to the Indonesian market, initially for specific travel reasons that from local press coverage applies to everyone!
Chart 2 – Domestic & International Capacity Splits, All Markets

Source: OAG
With an additional 161,000 weekly seats Vietnam could, based on recent weeks, have expected to move to a higher position in the top 10 global country markets; it has in fact remained in eighth place. The Philippines moves out of the top ten as both Cebu Pacific and Philippines Air Asia removed capacity this week; highlighting of course the challenges of working a way through an event such as COVID-19 that can strike back quicker than a premier league footballer! Mexico’s continued presence in the top ten is likely to be under threat next week, Germany is just some 22,000 seats behind and airlines are beginning to add capacity back in Western Europe.
Table 2- Scheduled Capacity, Top 10 Country Markets

Source: OAG
The biggest challenge in the next couple of months for the whole aviation industry and particularly airlines, airports and tourism boards will be seeing how demand recovers. There are many opinions on how that will play out and only time will tell but we have to remain optimistic. It is very clear that in the last few days airlines have started looking a bit further out in terms of capacity with new schedules being added for June and July. Analysing supply and demand together is important and we have been developing something in OAG that may be of interest.
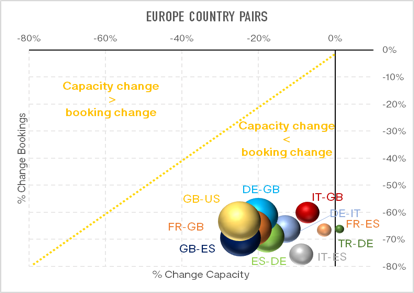
Combining current forward bookings from our data snapshot tool in Traffic Analyser with current planned capacity for July 2020 we have developed a comparative tool that shows comparison with the same time last year. The idea is to identify those country markets; routes or indeed airlines where current booking and capacity levels would suggest that we could reasonably expect capacity to be cut (or increased) looking further forward into the summer season. Of course, with very few bookings being made at the moment and many travellers trying to work out if they can or cannot travel there could well be a significant spike in booking activity once that clarity is forthcoming.
In the chart below we have looked at the ten largest Western Europe country to country and compared the current variances in booking and capacity for July against July 2019. Any market where the current change in booking activity is less than the current change in capacity reflects a market likely to have too much capacity. We know that many airlines and markets are likely to see further capacity cuts in July from those in the OAG database and we expect to see those changes in the coming weeks. The chart does however provide early visibility of where we should expect to see the greatest changes occurring and will certainly be useful for many analytics users seeking insights.
Chart 3 – US Scheduled Domestic Capacity and Cancellations, 1st April – 10th May 2020

The challenge of business recovery will be difficult for many as the chart above illustrates; matching capacity to demand and sensing when travel will pick up from an airline and revenue management perspective crucial. Airlines are literally having to test the market, add capacity back in and then adjust rapidly in response to demand and that is not easy for anyone. One example will illustrate that point.
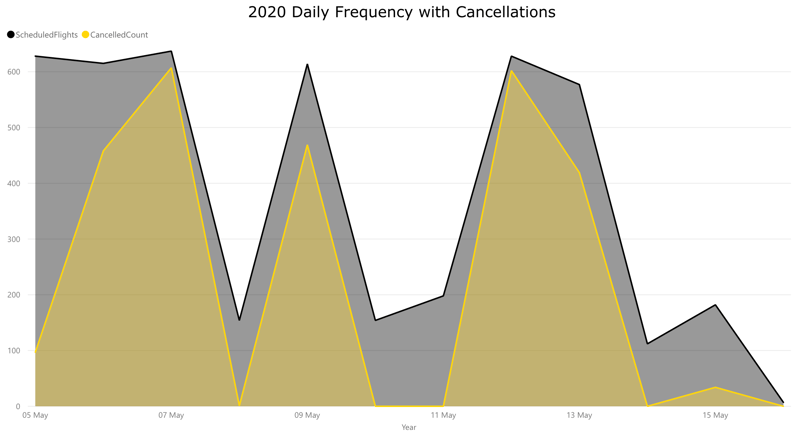
Wizzair, bravely introduced a significant build out of their scheduled services in early May. Reloading and placing much of their network back on sale the airline was amongst the first in Europe to try and return to normal operations; but short notice returns of capacity both allow little time for booking activity and as a result the airline ended up cancelling 90% plus of the intended flights. Wizzair’s actions were brave and highlights the challenge; it might also explain why some other carriers decided to cancel flights all the way through to the beginning of July very early in COVID-19; it gave the market a clearer steer of their planned schedules. We shouldn’t criticise Wizzair for almost being pioneers in the recovery; we may have to accept higher cancellation rates than normal in the coming months as travel rebuilds.
Chart 4 – Wizzair Cancellation Rate 5th – 15th May 2020

Next weeks capacity data is unlikely to show the same level of percentage growth as this given known lockdowns and airline schedule filings through to the end of May. However, carriers are already announcing and loading significant capacity increases for June, especially amongst the mainline carriers in Continental Europe where travel lockdowns and quarantine requirements appear to be easing.
With 213 airlines currently not filing schedules this week compared to the week of the 20th January and some 10,000 airport pairs still not being operated there is obviously a very long journey ahead of the industry. But at least it looks like the tide has turned.


