Operating to a schedule becomes increasingly difficult when the sheer volume of aircraft movements makes an airport congested. Minor glitches in operations or weather-related incidents can have a knock-on effect for hours and even days. We explored these issues in Great Expectations, a 2015 report which looked at what airlines are doing to manage these situations, and take a closer look at the on-time performance of Hong Kong International Airport.
With an annual capacity for 420,000 aircraft movements, HKG has been operating near capacity for some time. The Civil Aviation Department continues to add more capacity and is working to raise the daily target from 1,150 to 1,200 movements over the next few years.
On-time performance at Hong Kong is therefore a key performance indicator and the airport should be pleased to have improved performance in 2017, with 67.9% of flights on-time, up from 64.7% in 2016. We take a closer look at what is happening with schedules at Hong Kong to try and understand how airlines are coping with congestion and managing passenger expectations.
Elapsed Times Extended for Hong Kong’s Top 10 Routes
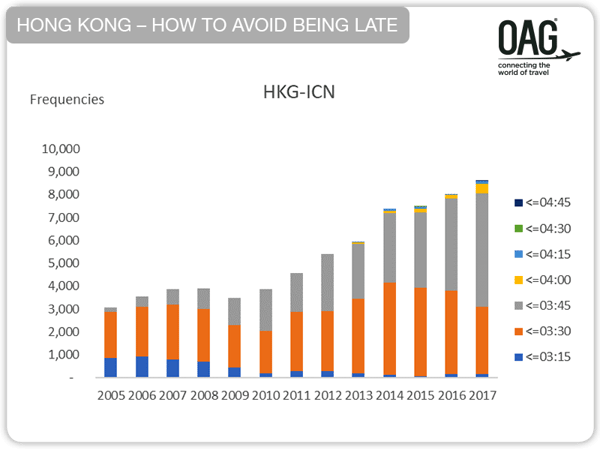
The top 10 routes from HKG are to Taipei (TPE), Shanghai Pudong (PVG), Bangkok (BKK), Incheon (ICN), Singapore (SIN), Manila (MNL), Beijing (PEK), Osaka (KIX), Tokyo Narita (NRT) and Kaohsiung (KHH). The charts below, drawn from OAG schedules data, show how the elapsed times for scheduled flights departing from Hong Kong to each of these destinations has changed since 2005.
The largest route, HKG to TPE, has seen the number of flights stay about the same since 2005 but in the last few years, the elapsed time for flights has increased. Where most flights were scheduled to take less than 1 hour 45 minutes, today most are scheduled to take somewhere between 1:45 hours and 2 hours. Similar trends can be seen on each of the other routes with the typical elapsed time getting longer.
 See all routes using the image slider below
While flights on a single route can be scheduled very differently, when we look at the average elapsed time by route there is a clear trend. Each of the Top 10 routes from Hong Kong has got longer. Even if the increase is only 6 minutes, as in the case of Hong Kong to Taipei, Hong Kong’s busiest route, it can make a difference. When a flight is classified as delayed when it arrives 15 minutes after its scheduled arrival time then that 6 minutes may be the difference between being delayed and on-time. This comes at a price, however. Longer sector times potentially mean more time in the air, fewer aircraft rotations and higher operating costs for airlines.
Do Longer Elapsed Times Lead to Fewer Flights Reported as Delayed?
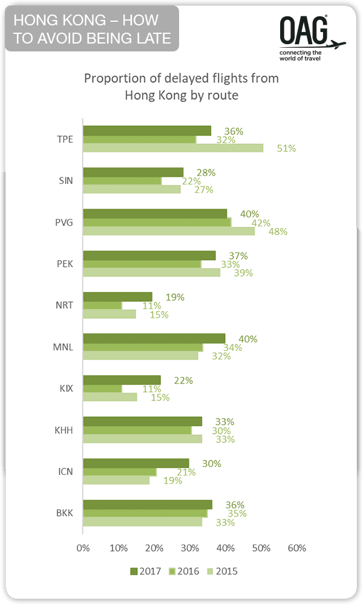
Unfortunately it would be simplistic to think that longer elapsed times were the simple solution to solving on-time performance, as other factors are at play. The evidence shows that there is no clear correlation between flight scheduling and delayed arrivals at destinations. While every one of the Top 10 routes from Hong Kong saw average elapsed times increase year-on-year in 2016 and 2017, the proportion of flights classed as delayed has shown a more mixed pattern.
|
Average Elapsed Time for Flights from Hong Kong - All Airlines |
||||
|
Destination |
2015 |
2016 |
2017 |
Minutes added |
|
BKK |
01:50:36 |
01:51:39 |
01:54:23 |
00:03:46 |
|
ICN |
04:32:07 |
04:32:39 |
04:35:25 |
00:03:19 |
|
KHH |
01:25:20 |
01:26:03 |
01:27:59 |
00:02:39 |
|
KIX |
04:35:45 |
04:36:31 |
04:41:19 |
00:05:33 |
|
MNL |
02:06:16 |
02:11:31 |
02:15:43 |
00:09:27 |
|
NRT |
05:13:00 |
05:14:27 |
05:16:01 |
00:03:01 |
|
PEK |
03:21:12 |
03:21:35 |
03:22:14 |
00:01:02 |
|
PVG |
02:27:53 |
02:30:20 |
02:32:30 |
00:04:37 |
|
SIN |
03:50:37 |
03:53:25 |
03:54:41 |
00:04:04 |
|
TPE |
01:43:05 |
01:48:32 |
01:49:33 |
00:06:28 |
For six of the routes – TPE, SIN, PEK, NRT and KIX, delays improved in 2016 but got a bit worse again in 2017.The proportion of delayed arrivals from Hong Kong improved each year for flights to Shanghai’s Pudong Airport but got worse every year on the Bangkok route.

Neither is there an obvious correlation between growth in flights on a route and the proportion of flights which are delayed. The volume of flights to Manila has grown a little but not a great amount in the last few years, but delayed flights have increased. The number of flights from Hong Kong to Osaka grew strongly in both 2016 and 2017 but the number of delayed flights improved in one year and got worse in another year.
Comparing Hong Kong Airlines and Cathay Pacific
So, is there a pattern to be found? Hong Kong Airlines was noted in the OAG Punctuality League 2018 as having the best on-time performance of any Asian airline with 88.83% of all flights arriving on time. This was a marked improvement from the previous year when it didn’t even make it into the league table. Hong Kong Airlines doesn’t operate on all the Top 10 routes from Hong Kong but on four of the routes where it does operate, and has done so since 2015, it has made some significant increases to the elapsed time in their schedules.
|
Average Time Added to Schedules for Flights from Hong Kong |
|
|
Destination |
Minutes added |
|
BKK |
6:04 minutes between 2015 and 2017 |
|
ICN |
12:18 minutes between 2016 and 2017 |
|
KIX |
17:19 minutes added between 2016 and 2017 |
|
TPE |
15:41 minutes added between 2015 and 2017 |
These are much larger increases than the average increases by all airlines, and on three of the four routes, substantially more. These appear sufficient to ensure that many flights which were previously classed at late are now on-time. It’s all a matter of managing passenger expectations.
How do these compare to flight times on flights operated by Hong Kong Airlines closest rivals, Cathay Pacific and Cathay Dragon?
|
Average Elapsed Time for Flights from Hong Kong by Airline - 2017 |
|||
|
Destination |
Average Flight time on Hong Kong Airlines |
Average Flight time on Cathay Pacific and Cathay Dragon |
Additional time on Hong Kong Airlines vs Cathay Pacific/Cathay Dragon |
|
BKK |
02:01:45 |
01:56:42 |
00:05:04 |
|
ICN |
04:44:29 |
04:34:28 |
00:10:01 |
|
KIX |
04:49:34 |
04:38:33 |
00:11:01 |
|
NRT |
05:21:25 |
05:13:38 |
00:07:47 |
|
PEK |
03:26:10 |
03:19:36 |
00:06:34 |
|
PVG |
02:35:37 |
02:30:50 |
00:04:47 |
|
TPE |
02:02:56 |
01:51:59 |
00:10:57 |
It appears that flights to these destinations are scheduled to take between 5 and 10 minutes longer on Hong Kong Airlines than on Cathay Pacific and Cathay Dragon, but with on-time performance a full 15 percentage points better at Hong Kong Airlines many passengers will decide the later arrival is worth it for peace of mind about their onward connections, pre-planned meetings on arrival and for the convenience of family and friends meeting them at the airport. Of course, while Hong Kong Airlines is managing on-time performance and passenger expectations, there will be a cost in terms of operating efficiency. Only the airlines will know if it is worth the price.
See the full routes below.


