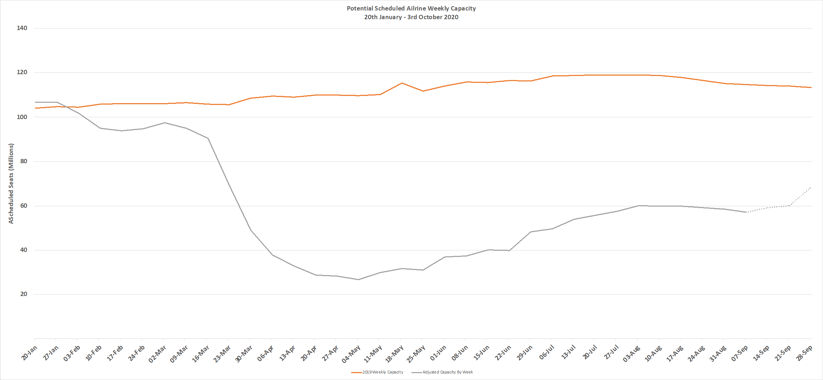
The increasing fear, or indeed reality of a second wave of Covid-19 in the last week appears to have had little immediate impact on weekly capacity. Those following these weekly updates will not be surprised by that, since we have been trending down over the last six weeks and many airlines had already responded to most recent changes in travel requirements from countries across the globe.
The headline numbers are stark; global capacity remains at 46% of that operated this week last year, 1.25 billion fewer scheduled seats operated since January than the previous year, sixty fewer airlines operating and sadly many airlines are making further redundancies as they prepare for the winter season. Airlines around the world continue to plead for Government support although quite why they were not stronger in their pleas for help in July remains a mystery since most of us could see what was developing. Hindsight eh!
The recovery, if it was ever that, has stalled. Although we are unlikely to see capacity fall off Beachy Head in the next few months, we probably face a steady reduction in capacity through to the end of October and perhaps through to the year end. The first week of October, the traditional start of the IATA Winter Season currently has some 73.6 million seats set to operate; that may soon become an airline network planner’s definition of optimism.
Chart 1 – Scheduled Airline Capacity by Week Compared to Schedules Filed on 20th January 2020 & Previous Year

Source: OAG
It’s reassuring to always report that North East Asia is the largest regional market (+1.5% this week) and that North America is hovering around 50% of its normal capacity or indeed that Western Europe continues to decline week on week as more quarantines are imposed. But that only tells half of the story and so this week we are highlighting those regions that continue to suffer the greatest capacity reductions.
Some thirty-five weeks into the pandemic there are still five regions with less than 30% of their base capacity; regions such as Southern Africa, Upper South America and the Caribbean continue to “top” the list of poorest performers. In many cases these markets either rely on air services to maintain access to key trading partners or in the case of the Caribbean tourism to keep the economies moving. In many cases scheduled capacity in these regions is also dominated by overseas airlines operating into the regions adding a further layer of complexity to their recovery. It’s not just the local restrictions impacting these markets but travel restrictions sometimes on the other side of the ocean can frustrate any attempted recovery
On a slightly more positive note, and it is of course all relative, capacity in South Asia has increased by some 12.7% week on week; all of which is based around “another” India capacity recovery. Let’s hope this one sticks and there is no need for a further cutback in the coming weeks.
Table 1 – Scheduled Airline Capacity by Weakest Performing Regions, 20th Jan – 20th September 2020 by Region

Source: OAG
As China prepares for Golden Week at the beginning of October capacity is now back to within 8% of January’s levels. Domestic capacity in China is now at 15.2 million seats a week which represents a 3.8% growth on the pre Covid-19 levels and load factors are reported to be nudging the 70% mark. China’s domestic market alone would now rank as the second largest regional market in the world; 50% larger than the whole of the North American market.
Spain’s continuing decline in capacity comes as no surprise since returning quarantine requirements continue to impact airline sentiment, since the 17th August scheduled capacity to Spain has fallen by one third.
Table 2 - Scheduled Capacity, Top 10 Countries Markets

Source: OAG
The list of top ten scheduled airlines now features what we consider many of the regulars pre Covid-19. Both Ryanair and easyJet have in recent weeks shared their plans for capacity cutback and both airlines continue to adjust capacity on a weekly basis with both airlines now operating around 70% of their January capacity levels.
Table 3 - Scheduled Capacity Top 10 Airlines

Source: OAG
For many airlines grappling with the constantly changing demand patterns and balancing capacity against travel restrictions has resulted in short-term schedule changes becoming a normal part of the market behaviour. This week we have looked at those airlines that have made the largest changes to their capacity over the last few weeks. Using this week’s data as a reference point we have tracked the capacity changes of all scheduled airlines since the 31st August, so effectively a two-week period.
Taking just one example, GOL, the carrier in the space of two-weeks reduced capacity by over half a million seats that it had intended to operate two weeks earlier in response to changing market conditions. The level of planning required to implement such a dramatic change in operation, equivalent to nearly 40% of their global capacity is immense from all of the operational planning and crewing requirements through to advising passengers of cancelations and their re-booking options. All of which adds huge cost to the airline for no revenue.
Airline network planning has never been more dynamic and that cannot be good for the industry, the traveller or any form of economic recovery.
Table 4 -Major Capacity Changes Over A Two-Week Period, 31st August – 14th September 2020

Source: OAG
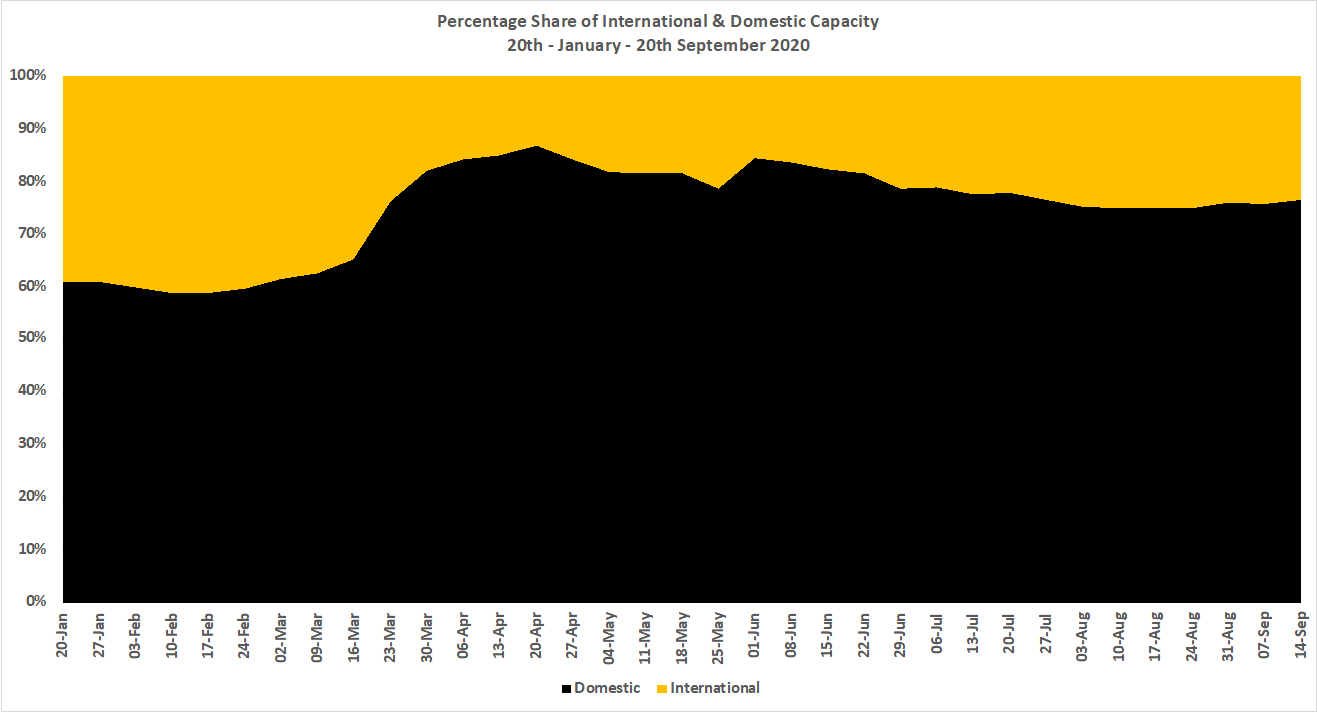
In preparing for the recovery, and there will eventually be a recovery; it may just be a few years away we have frequently commented on the quick wins coming from domestic and regional markets and the recent reductions in capacity have resulted in domestic share of global capacity now creeping back to just over 76% of all seats operated. In January domestic capacity was nearer to 68%. China, India and the Russian Federations recent capacity recovery covers up the capacity cutbacks we have seen in the US market from carriers such as Southwest and United Airlines; too much reliance on domestic capacity will not help airlines recover.
If you assume for a moment that the European Union is indeed one common domestic market rather than a series of international markets; and of course, the UK has some issues with that point, then current domestic capacity would increase to over 85% of all seats available this week. With domestic yields typically lower than those from international services the current imbalance of capacity needs to see a rapid correction.
Chart 2 – Percentage Share of Capacity By Domestic and International, 20th January to 20th September 2020

Source OAG
The dramatic and continued reduction in wide-bodied aircraft operations is highlighted in the table below where we compare this week’s capacity against that operated in January. Scheduled services on an A380 are now extremely rare with just 34,000 seats on offer this week which represents a near 97% drop from earlier this year. Of those 34,000 seats each and every one will be operated by Emirates, do they know something the rest of us don’t or are they burdened with an aircraft too big for the current market; answers on a small postcard please.
Table 5 - Wide-bodied Aircraft Capacity, 20th January to 20th September 2020

Source OAG
At the beginning of September, we noted that the next six weeks will shape the aviation and travel and tourism recovery through 2021 and beyond. Rapid actions needed to be taken, powerful and strong commitments made by regulators and consumer confidence could be restored. One-third of the way through that period and it feels that little has happened to believe that a way forward will be found; indeed, more barriers and restrictions are being imposed.
At some point there will be a recovery and those travel restrictions will be lifted and Governments will once again be encouraging us to travel and build new trade links and visit new destinations. If at that point Governments look around and wonder where are those airlines that they now need and see only a smattering of carriers have survived, then only at that point will they realise how much good and value aviation created for everyone.
And at that point, who do they blame then?


