


Distance, time and capacity are only a few ways in which the airline industry measures its Top 10, but there are other more telling measurements available. For instance, the Top 10 in terms of revenue produced; that’s an interesting list which doesn’t get shared very often.
Combining our flights schedules and traffic data we’ve created a list of the Top 10 and it reveals some interesting data as you can see below.
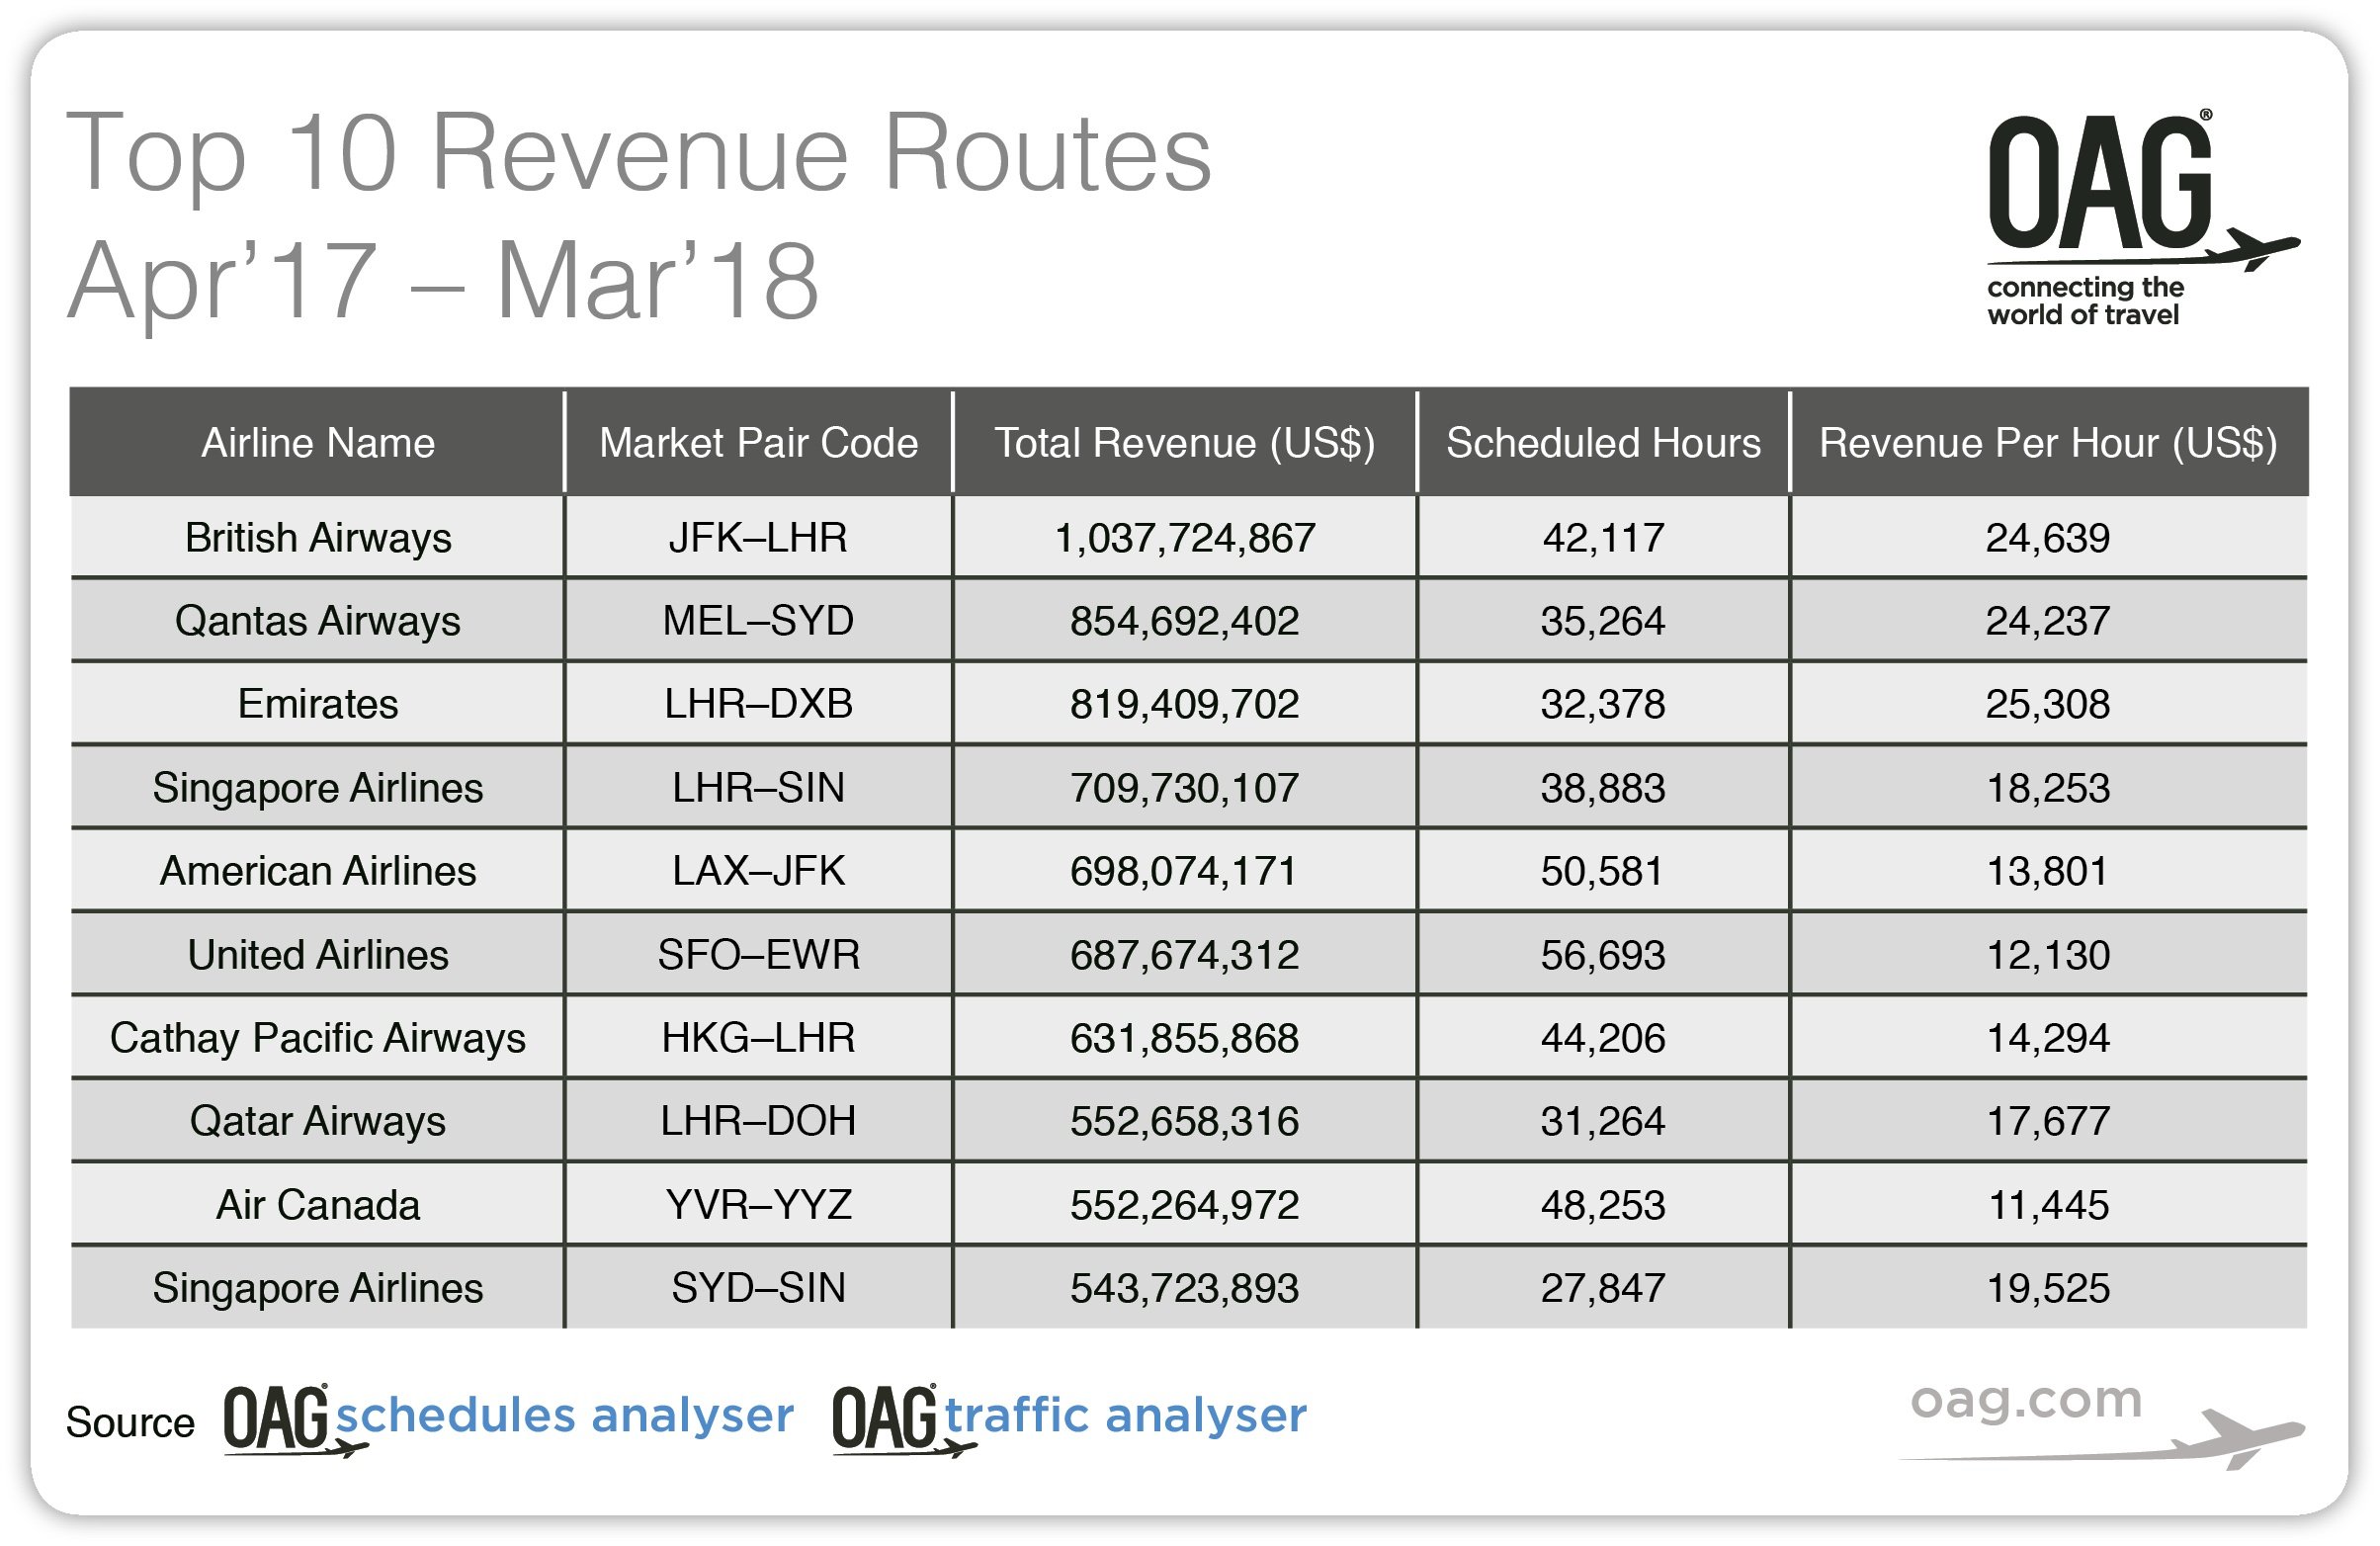
The World’s Top 10 Routes...in revenue terms
*click here to see full size image*
Globally one route breaks the billion-dollar threshold, the British Airways LHR – JFK service and that’s about 6% of BA’s total revenue in 2017. On an hourly basis, that equates to US$24,639 which amazingly is not quite the highest hourly earner. That accolade goes to the Emirates LHR – DXB service that ranks third in the Top 10.
Incredibly, five of the top ten revenue earners are either to or from London Heathrow which may explain the ongoing debate about the third runway with the increased competition damaging those lucrative earners.
And in the same vein perhaps the OneWorld Alliance needs to find a sub-brand for its Heathrow services since three of the world’s top ten revenue generators share Heathrow in common.
All of the Top 10 routes are also high-cost operations, combining generally wide-bodied services with high frequency, in the case of MEL – SYD with Qantas operating around 65 flights a day on just that one route. Typically, these routes also include a high proportion of business traffic, later booking and higher yielding in nature. Whilst the cost of operating may be high, at least the revenues are likely to be even higher!
This is only one-way to look at the data and highlights the value of combining data sets but it shines an alternative light on lucrative routes operating currently.