Analyzer Version History
ANALYzER IS CONSTANTLY BEING UPDATED TO ENSURE OAG CAN PROVIDE THE BEST SERVICE TO YOU.
Over the years, the Analyzer platform has undergone advancements and alterations in order to ensure users can have maximum flexibility to create the best analysis they need.
See below the version updates we have introduced.
Analyzer 2.8 - Mini release November 2023
Introducing New Region Aggregations
We have made improvements to the way we group our regions in our Schedules Analyser Origin & Destinations. Previously, regions were only available in sub-region levels e.g Africa: North Africa (AF1), Africa: Southern Africa (AF2). We have now made available top-level regions in the product e.g Africa: All (AF0), representing all relevant sub-regions in one so that you can more easily and efficiently create region to region queries.

Introducing New Query Containers
We have introduced new query containers to ensure all users are able to get the most out of analyser. These containers represent a maximum fixed size a query can be as well as what a query must contain. These are:
- A maximum query span of 5 years
- The inclusion of at least 1 Origin or 1 Destination or 1 Carrier
You can still access historical data by creating more than one report. If you require access to more data or would like to broaden your query, please contact your account manager to discuss other data solutions.
Release date – 15th November 2023
Analyzer 2.7 – Mini Release June 2022
INTRODUCING NEW TIMESERIES DATE FORMAT
We have made improvements to the way our timeseries displays dates. Previously this field used to be a string. It has now been formatted to retain the date structure even while exporting. The formatting is as follows:
-
Year: YYYY (e.g. 2019)
-
Quarter: YYYY-QQ (e.g. 2019-Q2)
-
Month: YYYY-MM (e.g. 2019-08)
-
Date: YYY-MM-DD (e.g. 2019-08-18)
This is relevant for the Schedules and Connections modules only so that when data is exported, the data format is retained improving the ease of use of our reports without the need to format.
INTRODUCING HOVER FUNCTIONALITY
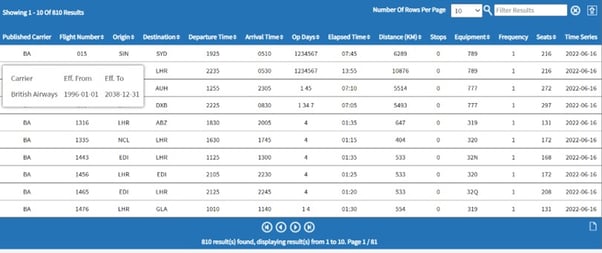
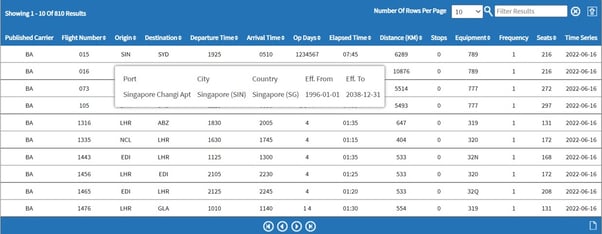
When the report results are output and there are codes within (Airport and Airlines) if you hover over you are able to see more detailed information. This allows customers to get basic simple reference information without having to run a separate report.
This feature is relevant in the Schedules Connections and Traffic modules only
Please see screenshots below
Carrier Code Example
Origin and Destination Example
Analyzer 2.6.1 – Mini Release February 2021
INTRODUCING MAPBOX
This development see’s our maps move from Google Maps to Mapbox in all Analyzer products: Schedules, Connections, Traffic, Mapper, Reference and Demand Analyzer.
Using Mapbox brings the following advantages to Analyzer:
- It will allow our Chinese customers to access all Analyzer maps with no issues
- The way maps are rendered on screen means they are faster. If you have many points on the screen, when you move about, it stays smooth. It also plots maps with lots of points quicker on initial load.
The specification for this development is to make all functionality in each Analyzer report the same in Mapbox as Google Maps. All reports work in the same way with customization, pop up tables in Connections Analyzer, search functionality, Zoom functionality etc. The only difference is in custom maps in Mapper. In Google maps, this is the functionality which allows a user to fully customize maps using Google’s API. This functionality has changed slightly with Mapbox but this customization is still available. Here is a step-by-step guide to using this in Mapbox
Examples of maps in Analyzer using Mapbox.
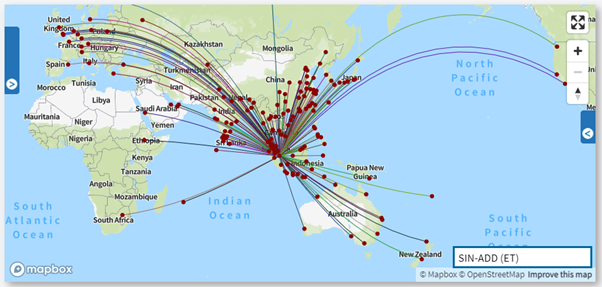
Figure 1 -Map showing all departures from Singapore Airport (SIN) in 2019 using Mapbox in Schedules Analyzer Capacity Report
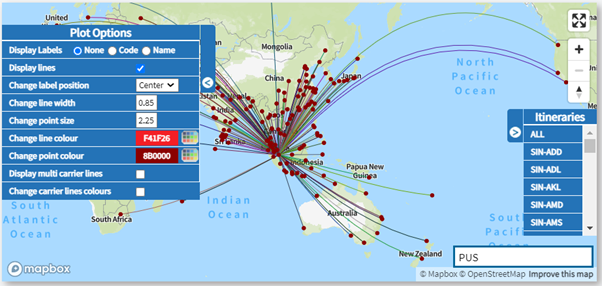
Figure 2 - Map showing all departures from Singapore Airport (SIN) in 2019 using Mapbox in Schedules Analyzer Capacity Report with Plot Options customization shown on the left-hand side and Itinerary search on the right-hand side
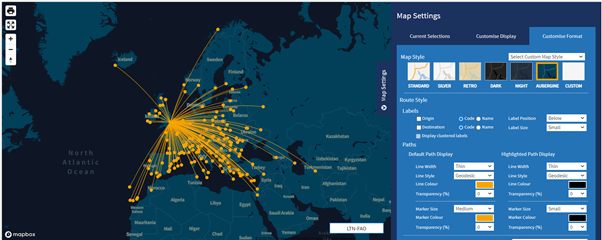
Figure 3 - Map showing departures from London Luton Airport (LTN) in 2019 using Mapbox in Mapper. This map is customized using Map Style Aubergine in Map Settings
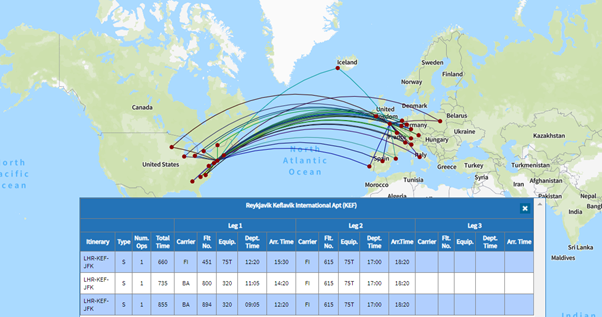
Figure 4 - Map showing all possible connections from London Heathrow Airport (LHR) to New York (JFK) on the 25th February 2019 using Mapbox in Connections Analyzer Connections Analysis Report
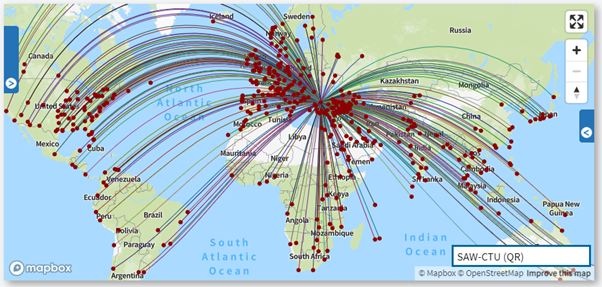
Figure 5 - Map showing all estimated passengers out of Istanbul Sabiha Gokcen Airport (SAW) in the month January 2019 using Mapbox in Traffic Analyzer O&D Report
Analyzer 2.6.0 – Mini Release February 2021
ENHANCED TRAFFIC DATA
In low penetration markets, in particular low cost carrier markets, we have seen issues with the Point of Sale (POS) allocation in the adjusted passenger data in Traffic Analyzer. This has been a point of confusion for customers and so we have adjusted the calibration process to take into consideration these type markets. The new enhanced adjusted passenger data went live on the 7th February 2021.
Example
Point of Sale Allocation for London Stansted Airport (STN) to Belfast International Airport (BFS) for year 2018.
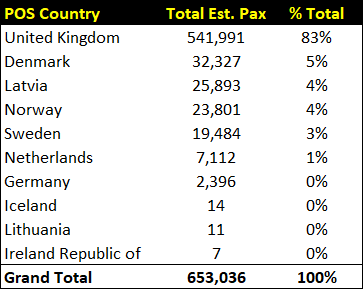
Figure 1 - 'Old' Calibration STN-BFS Year 2018
Figure 1 shows an example of the Point of Sale (POS) allocation for London Stansted Airport (STN) to Belfast International Airport (BFS) for the year 2018 using the 'old' calibration process. This route is operated by two low cost carriers Ryanair and easyJet. The POS allocation should be 50% United Kingdom and 50% Ireland because this is a low penetration (bookings) route and there is insufficient data to accurately model the POS to each country market. The previous calibration process weighted the Point of Sale up to Total Est. Pax which is why we see these numbers for the above countries.
The new enhanced adjusted passenger data with updated Point of Sale allocation has been restated back to January 2017.
Analyzer 2.5.11 – Mini Release May 2020
NEW FUNCTIONALITY TO TRAFFIC ANALYSER – HISTORICAL SNAPSHOTS
This new release contains new functionality to Traffic Analyzer, Historical Snapshots.
Overview
This new feature will allow customers to analyze how bookings have changed over time using historic databases of traffic data. This complements the functionality already in Schedules Analyzer, for Historical Schedules Snapshots.
In short, Historical Snapshots for Traffic Analyzer will enable customers to look back to a historical point and look forward from that time. This will be beneficial now, and in the coming months as it will provide more visibility and context around future bookings.
In general, we are anticipating that there is going to be a slower build back of passenger demand and you may have read about this already or heard it in some of our webinar discussions. There will at certain stages be a ‘rush’ of capacity coming back into the market however the sentiment just now is that demand will be much slower to come back than previous market shocks. So, by having the historical snapshots in Traffic (as well as in Schedules as we have now), this will help users to make smarter decisions.
We will have monthly snapshots back to January 2019 available at launch and intend to hold this as the start month until we have 2 years of history, and then roll forward. This gives a long window of time for customers to include the pre Covid-19 timeframe.
What’s in the Release?
Below is a worked example based on a general use case – as an analyst (Airline, Airport, Consultant, Hedge Fund...), I want to be able to access historical snapshots of traffic data so that I can analyze how traffic has changed and is changing over time in order to better assess market demand.
Historical Snapshots can be found in the Power Table in Traffic Analyzer:

‘Data Snapshot Date’ is a drop-down box which allows the user to select which Traffic snapshot they want to query. All dimensions, metrics and input options in the middle panel work with all snapshots, however, only the metrics relating to unadjusted data (as it will be forward looking data from the data snapshot date) will return values – other metrics e.g. Total Est Pax will return zero values.
The ‘Latest’ snapshot is the default, and this will be updated each month in the normal refresh of the Traffic data. Each snapshot gives data for 1 year in the future. The ‘Period’ filter will still default to the last month of Preliminary Adjusted data (as it currently is in Traffic Analyzer).
Worked example
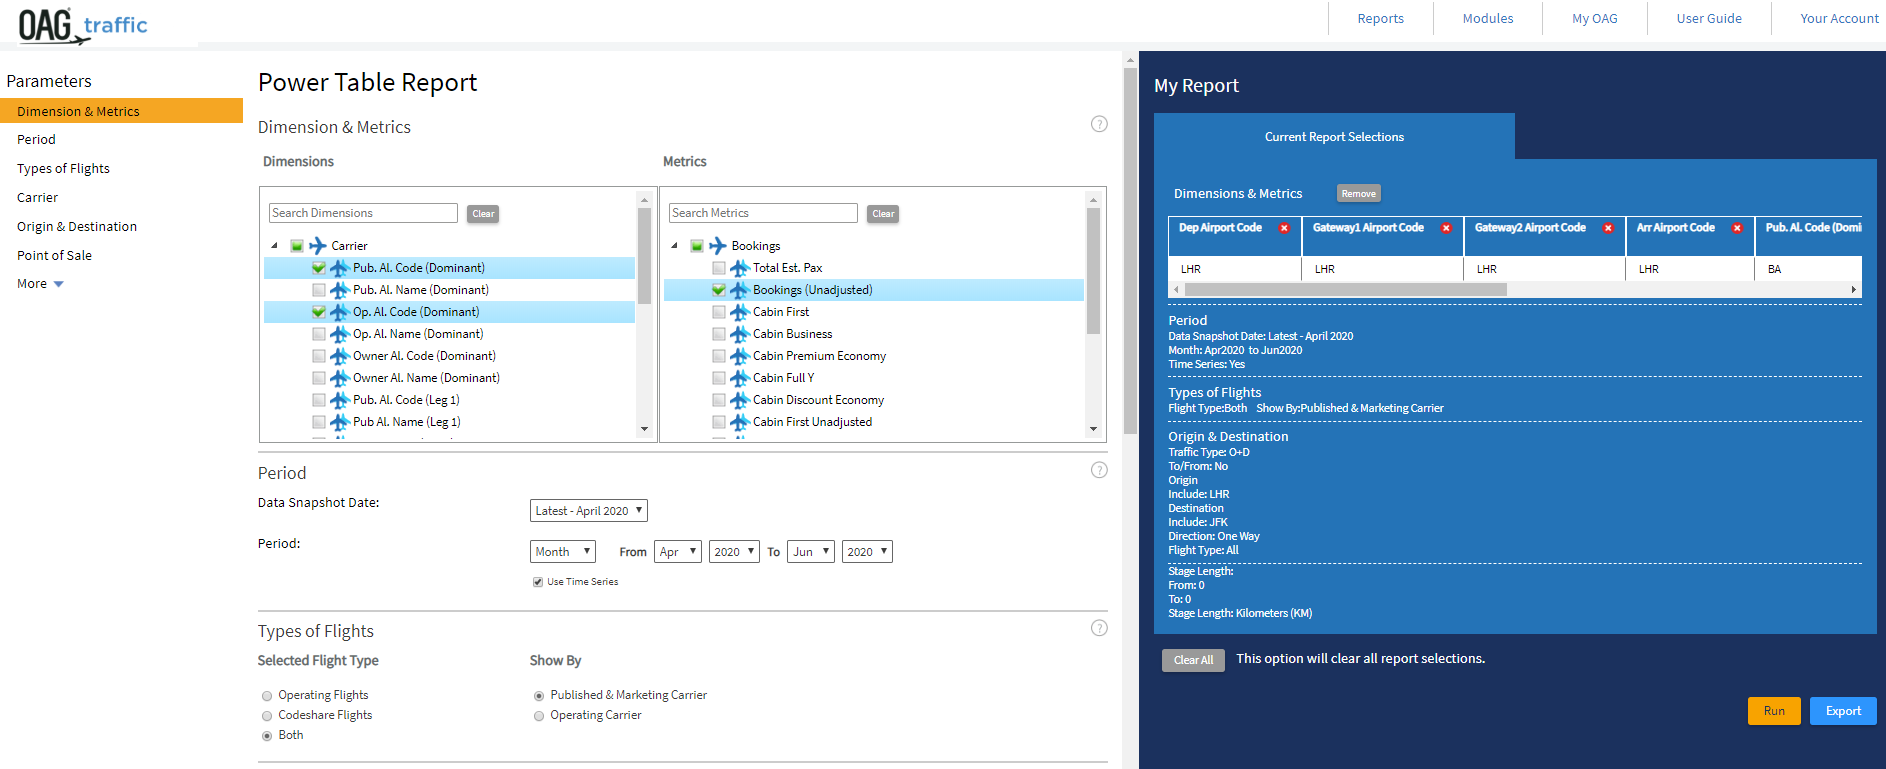
I want to analyze how the future booking volume for the months of April-June 2020 for the route London Heathrow (LHR) to New York J F Kennedy (JFK) has changed by comparing the January 2020 snapshot and the April 2020 snapshot.
Figures 2 and 3 show screenshots of how to set up the Traffic Analyzer Power Table to retrieve data for this example, with sample dimensions and metrics chosen. Figure 2 shows set up for the January 2020 snapshot and figure 3 shows for the April 2020 snapshot. These can be either run on screen or exported to excel.
Figure 2 – Screenshot of our example set up in Traffic Analyzer, LHR-JFK for the months Apr-Jun 2020 using Jan 2020 snapshot
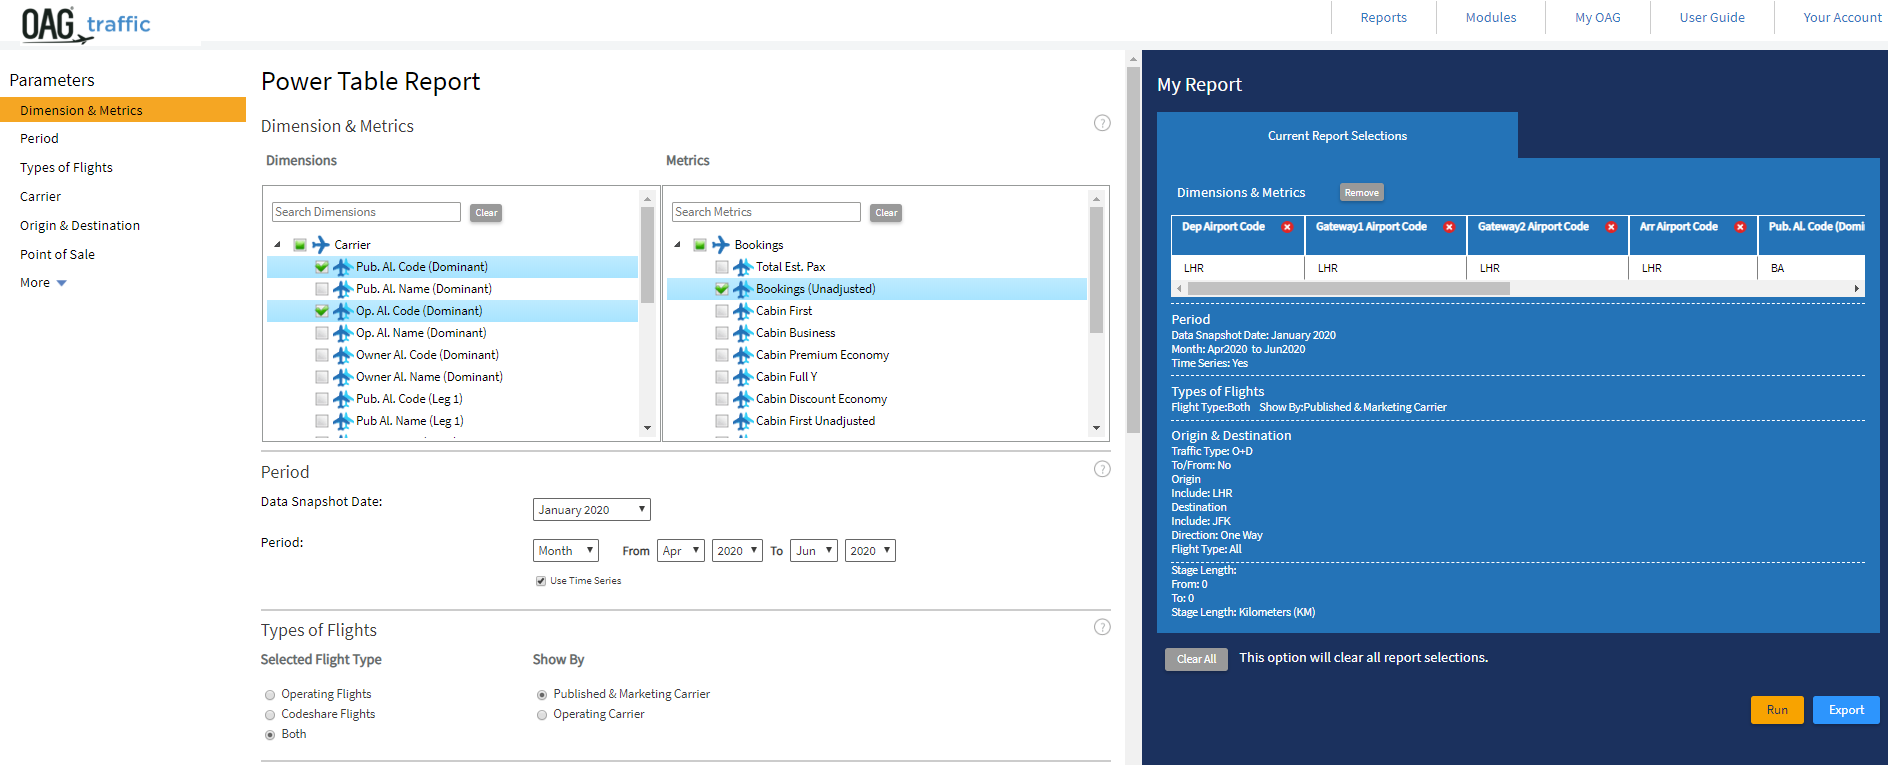
Figure 3 – Screenshot of our example set up in Traffic Analyzer, LHR-JFK for the months Apr-Jun 2020 using Apr 2020 snapshot
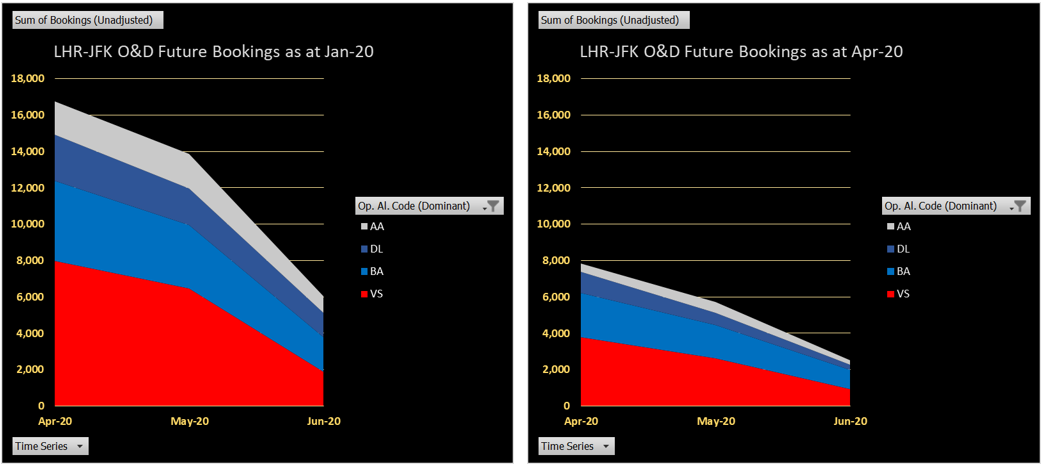
Figures 4 and 5 below are the screenshots of the results screen for these examples.
Figure 4 – Screenshots of the results of our query for January 2020 Snapshot
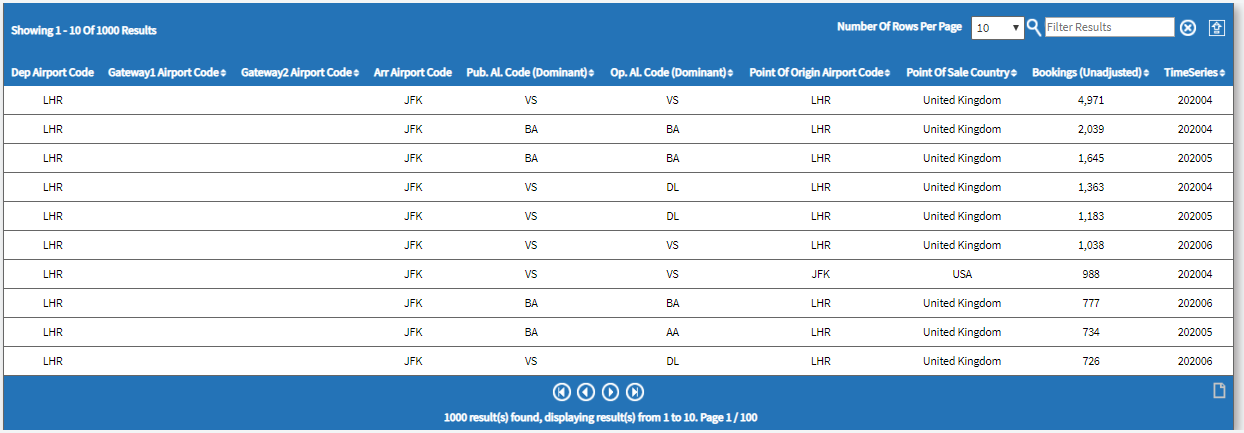
Figure 5 – Screenshots of the results of our query for April 2020 Snapshot
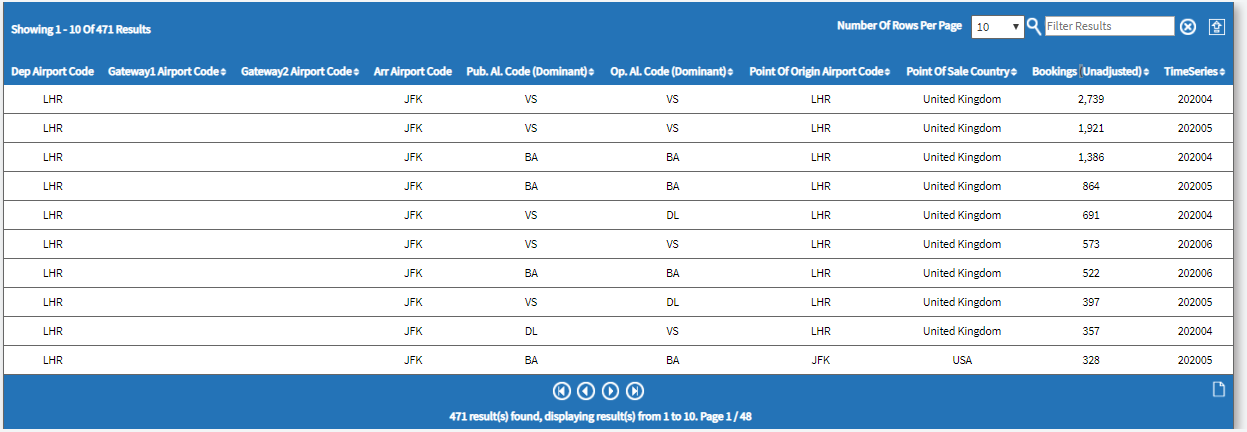
Figure 5 – Screenshots of the results of our query for April 2020 Snapshot
Figure 6 below shows the output of the data (pivoted the excel output and showing side by side for comparison). This very clearly shows the dramatic impact on the future bookings – for these four carriers, the bookings are down 56%! (Virgin -55%, BA -46%, Delta -64%, AA -72%).
Figure 6 – Screenshot of snapshot comparison by Operating Airline
This example is only comparing two snapshots to illustrate the value of the comparison however the user will have the full flexibility of the Power Table, and 12 months of data for each snapshot in order to build more complex analyses over a longer period of time.
Release date – 5th May 2020
Analyzer 2.5.10 - Mini Release July 2019
This new mini release of Analyzer contains the following bug fixes and a schedules data update.
Bug Fixes
• Schedules Analyzer - Historical Snapshots – Paris Charles de Gaulle Airport (CDG) made an update to their city reference data from the 28th April 2019 so no data was available in our historical snapshots due to the UID changing in our database. This has now been fixed so historical snapshots databases read the correct reference data.
• Connections Analyzer – Under Connection Window (hours), the MinCT drop down box was not working, the product was not changing the minimum MCT number. This has now been fixed.
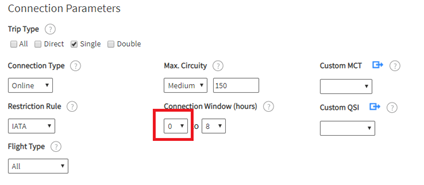
Figure 1 - Screenshot of Connection Parameters in Connections Analyzer highlighting the minimum connection window
• Connections Analyzer – QSI (%) column was not totaling 100% in some tabs. The QSI (%) column takes the QSI score for each row of connections data and divides it by the total to get the %. This allows analysis of how likely a connection will be used. This column should equal 100%.
• DOT Analyzer – DB1B – Two Way/Aggregate would sometimes not bring any data back. This was a very isolated issue and only effected one customer. It was to do with a wait time component, we have changed this slightly and it is now working ok.
• Traffic Analyzer Scheduled Reports – In Traffic Analyzer we have two scheduled reports which have the same file name. When the two reports were run as a CSV output it combined the two reports. This has now been fixed so each file is run separately.
Data Update
• Data Update – For BA’s A318’s we were showing 107 seats instead of 32 for the period September to November 2009 and August 2017 onwards. This has been updated.
Release Date - 16th July 2019
Analyzer 2.5.9 - Mini Release May 2019
NEW FUNCTIONALITY TO SCHEDULES ANALYZER - HISTORICAL SNAPSHOTS
New functionality has been developed in Schedules Analyzer in this new release called Historical Snapshots. Previously the Schedules Analyzer database was overwritten each week giving the latest schedules information. This new functionality continues to do this so the latest schedules data is available however we have been saving historical schedules snapshots weekly back to the 17th December 2018. These are now available to query in the Schedules Analyzer Power Table. Having historical snapshots of the schedules database allows analysis of how schedules have changed over time and to analyze what has changed week on week when the latest data is loaded.
Historical Snapshots in Schedules Analyzer Power Table

Figure 1 - Screenshot of new Historical Snapshots functionality in the Power Table
Figure 1 shows where to locate the new historical snapshots functionality in the Power Table. ‘Data Snapshot Date’ is a drop-down box which allows the user to select which schedules snapshot they want to query. All dimensions, metrics and input options in the middle panel work with all snapshots. The ‘Latest’ snapshot is the default, and this will be updated each week in the weekly refresh (as normal). This gives data for 1 year in the future and all historical data according to the user’s subscription. Each snapshot (in the drop-down box below the ‘Latest’) contain data for 1 year in the future from the snapshot date and historical data back to the beginning of the year of the snapshot.
Example – I want to analyze how schedules for the week 15 - 21 July 2019 for the route Luton Airport (LTN) to Malaga (AGP) have changed by comparing 17th December 2018 snapshot and 20th May 2019 snapshot.
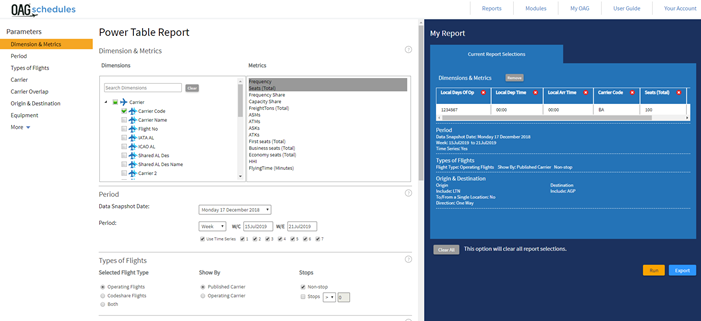
Figure 2 – Screenshot of our example set up in Schedules Analyzer, LTN-AGP for the week 15-21 July 2019 using Monday 17th December 2018 snapshot.
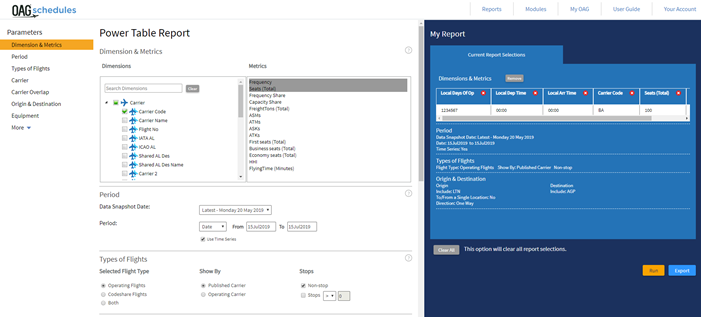
Figure 3 – Screenshot of our example set up in Schedules Analyzer, LTN-AGP for the week 15-21 July 2019 using the latest snapshot available Monday 20th May 2019 snapshot.
Figures 2 and 3 show screenshots of how to set up the Schedules Analyzer Power Table to retrieve data for this example. Figure 2 shows set up for December snapshot and figure 3 shows for May snapshot. These can be either run on screen or exported to excel. In this example we will export to excel.

Figure 4 – Screenshots of the results of our query in Excel
Figure 4 shows these queries exported to excel. Comparing the two tables, one for May 2019 snapshot and one for December 2018 snapshot, shows for this week 15-21st July 2019 schedules have not changed much for Thomson (TOM) and EasyJet (U2) but they have for Ryanair (FR). FR in the December snapshot had quite a split schedule with days 2,3 and 4 not being at the same time, day 3 was also scheduled to depart in the evening. In the May snapshot we can see these scheduled have changed and all FR daily flights depart at 06:35 and arrive at 10:30.
Bug Fixes
• ‘Compare To’ feature in O&D Report had an issue when running a larger query on screen and the number of rows being returned where above 1000 rows. The issue was the two data sets for the different time periods when being run separately and a random 1000 rows was being returned for each time period. This meant that there were a lot of zero’s being show in the UI for one time period. This has been fixed, the UI now runs both data sets fully and shows the top 1000.
• In Schedules Analyzer, the new A330neo aircraft was under equipment type ‘Jet’ and not ‘Widebody’ as well. This has been fixed so it is under both.
• Data fix - Safarilink (F2) had some schedules out of TSV in Australia which where not correct for the week commencing 11th February 2019, these have now been deleted.
Release date - 28th May 2019
Analyzer 2.5.8 - Mini Release April 2019
Update to 'Compare To' Functionality in Traffic Analyzer O&D Report
This new release of Analyzer contains an update to the ‘Compare To’ feature in Traffic Analyzer O&D Report. This is a very useful report and the new output makes it much easier to analyze how markets have changed between two time periods. This release also has updates to the new Exclude Scheduled Flights functionality in Connections Analyzer and two historical data fixes to the schedules database.
Update to 'Compare To' Feature in Traffic Analyzer O&D Report
The ‘Compare To’ feature in Traffic Analyzer O&D Report allows analysis of passenger numbers for two time periods. This is a very useful report however the output was not clear. In this release of Analyzer we have tidied this up to make it more readable.

Figure 1 - 'Compare To' feature in O&D Report
Example - How has the market from London Heathrow (LHR) changed Year on Year (YoY) 2016 vs 2015.
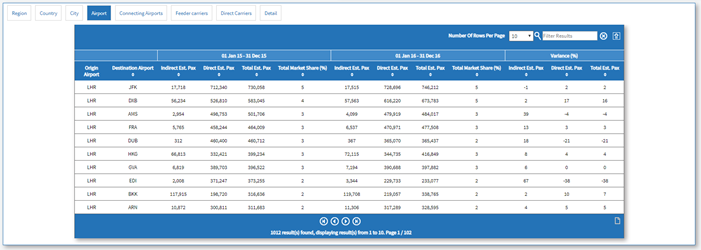
Figure 2 – New ‘Compare To’ output in Traffic Analyzer O&D Report
Figure 2 shows the new ‘Compare To’ results table. In this example, LHR-DXB is performing well YoY as is up +16%, mostly driven by an increase in direct passengers +17%. LHR-EDI has performed poorly -38% YoY, a lot of this driven by less direct passengers -38%. Looking at Schedules Analyzer this dip in passenger numbers is because Virgin’s Little Red (VS) service was cancelled in 2016. Indirect passengers are up +67% on LHR EDI however this will be a result of losing the extra frequencies of VS. The indirect number is small compared to the direct number though.
Exclude Scheduled Flights Updates
We have made a couple of updates to the new functionality in Connections Analyzer Exclude Scheduled Flights.
• When a user saved a new group of flights to exclude this was not automatically applied to the query. We have added a ‘Save and Apply’ button so the user can now save their new group and apply it to their search query.
• When a user edits a saved report the ‘Saved Flights’ at the bottom of the right hand panel now defaults to the saved group to make it easy for the user to save any flight selection changes.
• Allow users to select multiple flight numbers in the exclude flights search screen.
• When a user has searched for flights to exclude the table will be sorted by Carrier, Origin, Destination and Dep. Time.
Data Fixes
• Iran Air (IR) filed schedules with us for BUD-IKA for April to July 2018 and they did not operate these flights. These flights have been deleted from our historical schedules data.
• Aeroflot (SU) SVO-CRC Flight No. 2997 for 2015, 2016, 2017 were test flights and should not have been loaded into Analyzer. These have now been deleted in our schedules data.
Analyzer 2.5.7 - Mini Release March 2019
New Exclude Scheduled Flights in Connections Analyzer.
This release of Analyzer contains important new functionality in Connections Analyzer. One of the main uses of Connections Analyzer is to be able to model the impact on connections from adding a new phantom flight. Exclude scheduled flights takes this a step further, it allows a user to delete current scheduled flights to model the impact on connections from taking these flights out. A user can combine Exclude Scheduled Flights with Phantom Flights to exclude flights and add in new flights to model how this effects connectivity. Also in this release a new search option has been added to Schedules Analyzer to search by State.
Exclude Scheduled Flights
Exclude Scheduled Flights is in a new section called ‘Customize Flights’ with Phantom Flights.
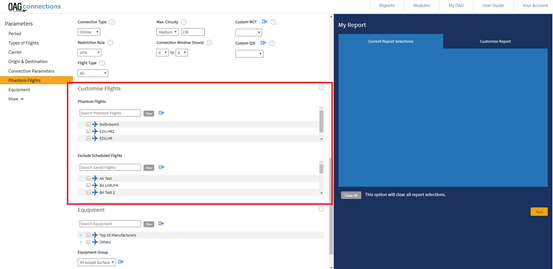
Figure 1 – New Customize Flights section
To start to use Exclude Scheduled Flights click the blue arrow to take you to the right-hand panel.
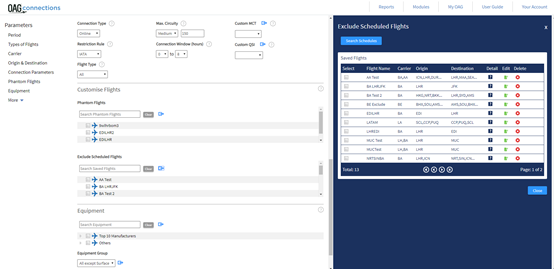
Figure 2 – Exclude Scheduled Flights section in right hand panel
Figure 2 shows how Exclude Scheduled Flights looks in the right hand panel. There are two options here; you can either make a new search to search for flights to exclude (click ‘Search Schedules’ button) or you can select a saved selection of flights from previous searches or edit/delete groups.
Saved flight selections are shown in the right-hand panel under ‘Saved Flights’ or these can be found in the middle panel as well.
When you click on ‘Search Schedules’ a new panel shows in the right-hand side. Here you can search for schedules you would like to exclude from your query. Click 'Find Out More' below to read the release notes for this new functionality and to go through a worked example.
State Search in Schedules Analyzer
From customer feedback we have added the option to search by 'State' in Schedules Analyzer. The ‘State’ search is a radio button located with Airport, City, Country and Region in the middle input panel under Origin & Destination in all reports. The user can also exclude by 'State'. 'State' dimensions are also included in the Power Table under dimensions.
State is located in the input screen here:
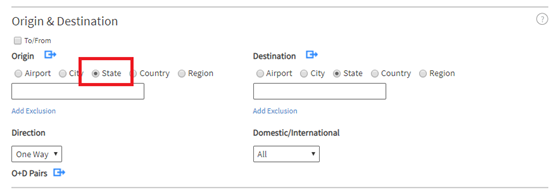
Figure 3 - New State search option
New Power Table Dimensions are called:
- Dep State Code
- Dep State Name
- Arr State Code
- Arr State Name
Analyzer 2.5.6 - Mini Release January 2019
New Search by Departure and Arrival Time Window in Mapper.
This new release of Analyzer gives Mapper customers the ability to search for flights by departure and arrival time window. The map will use the user's selections and plot this on the map. User's also can exclude a departure and arrival time window. This is similar to the functionality in Schedules Analyzer.

Figure 1 - Departure and Arrival time window in Analyzer input Screen
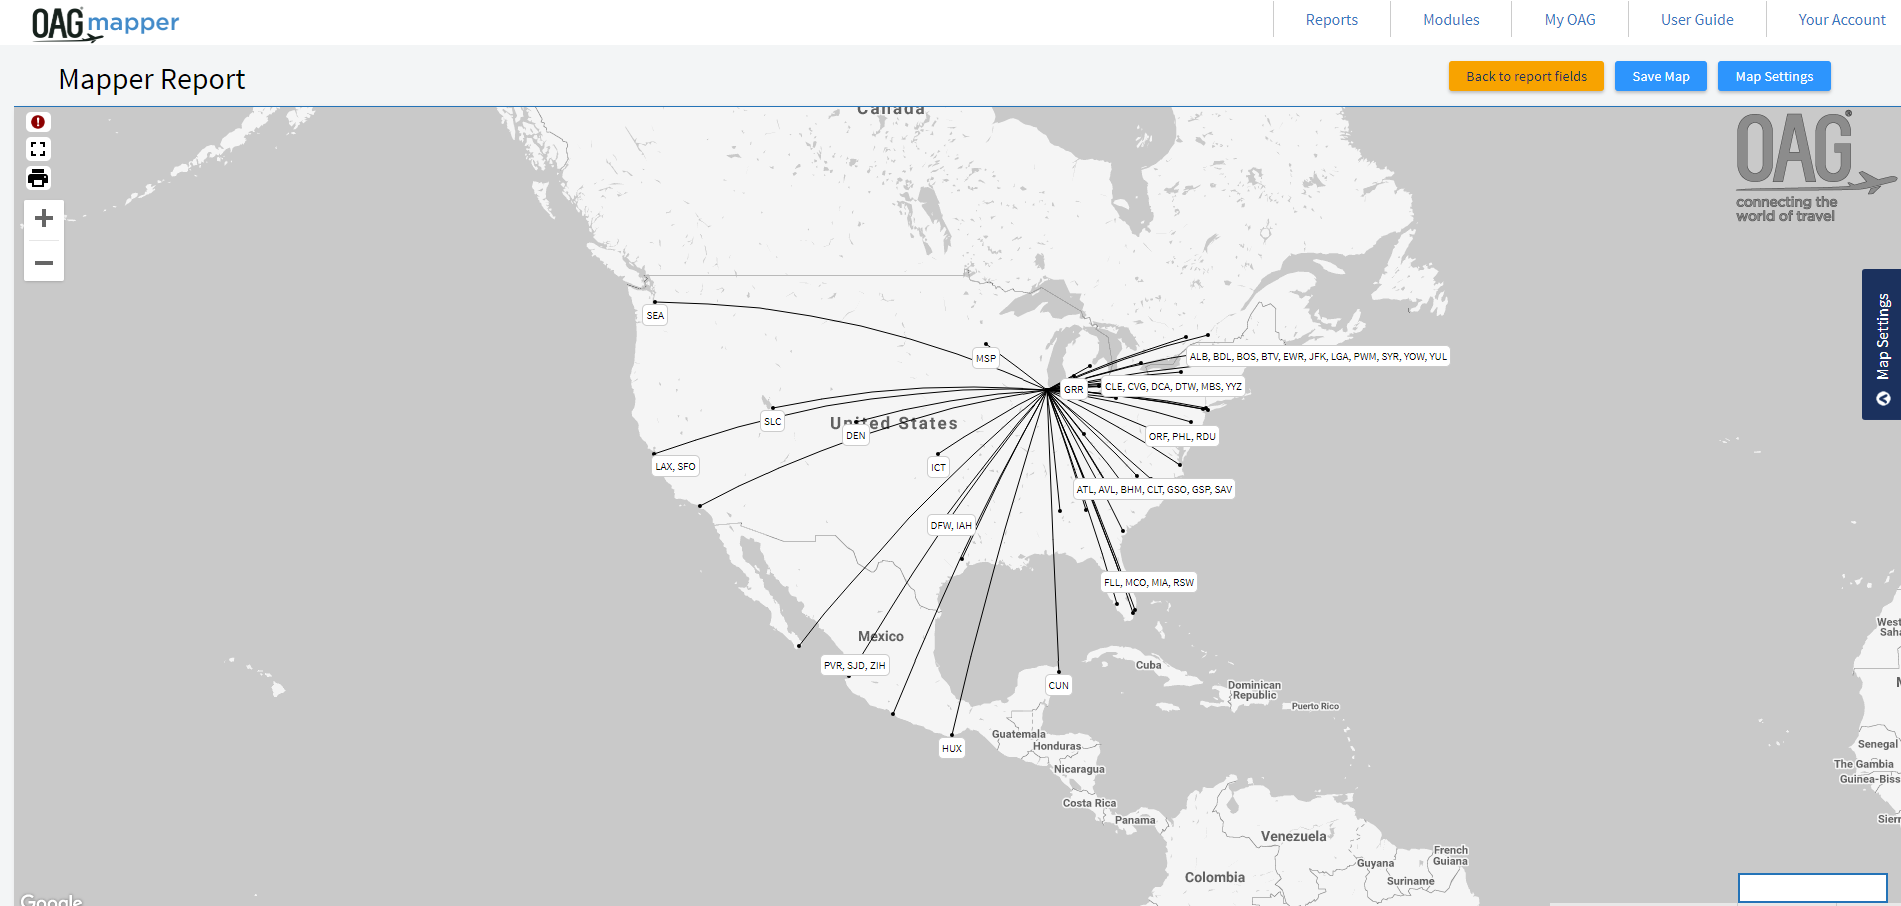
Figure 2 - Map of scheduled flights from Chicago O'Hare International Airport (ORD) between 06:00 and 07:00 for January 2018
Figure 2 shows an example of this new feature. The map shows departures from Chicago O'Hare International Airport (ORD) between 06:00 and 07:00 for January 2018. This shows there are only flights to
To continue to improve the quality of our releases and deployments, this release also includes changes in our backend processes. The improved process ensures that the deployment for production is of
Analyzer 2.5.5 - Mini Release December 2018
New Exclude Carrier Functionality in Connections Analyzer
This release of Analyzer contains new functionality to Connections Analyzer. A user can now exclude a carrier’s schedule from their query in both the Connections Analysis Report and the Missed Connections Report. We have also made some performance upgrades to Connections Analyzer.
Connections Analyzer – Exclude Carrier
We have received feedback from our customers that they would like to build connections excluding a carrier in Connections Analyzer. In both the Connections Analysis Report and the Missed Connections
Under the ‘Carrier’ input box shows the text ‘Add Exclusion’:

When a user clicks ‘Add Exclusion’ an input box appears below the carrier box allowing the user to select a carrier to exclude. The

Connections Analyzer – Performance
Connections Analyzer uses staging tables in its flow to store user query data. These staging tables are then used for showing results on screen. Over years, these tables have grown a lot without maintenance and this puts a burden on the Database server when it executes its queries.
The back end data load process for Connection Analyzer has been updated so that our staging tables remain optimized to only recent data. The daily maintenance job now removes stale data from ALL the staging tables.
Since these staging tables are now optimized to only hold recent data:
- The UI rendering will be quicker.
- Any SQL query for the staged CA data will be quicker.
- There will be less load on the server.
Mapper
- Bug Fix – Changing the color of the lines in Mapper was not working for both Display and Highlight. This has now been fixed.
Analyzer 2.5.4 - Mini Release November 2018
Analyses Maintenance Release
In this new release of Analyzer we have a mixture of maintenance work and bug fixes to Schedules and Connections Analyzer, the Job Bin and Scheduled Reports.
Schedules and Connections Analyzer
- Schedules Analyzer - Top X Report – The Top X report previously searched by Airport Name instead of Airport Code. This meant if an airport changed its name there would be multiple lines of data which made it difficult to analyze. In this release we have changed the report to search by airport code and then apply the latest airport name. This eliminates the problem.
- Schedules Analyzer - Stops option box in all reports was not big enough to populate the selected parameter >, < or =. This has now been changed.
- Bug - Connections Analysis Report – If a report was run using the job bin, the user had selected the connections tab only and it generated no results, the UI in Analyzer when downloading this report would just keep running so it looks like the report is still running. This has been fixed so the download option still gives an output if there is no data and the UI has been fixed.
Job Bin
- Job Bin – If a user deleted a report that had been run in the job bin there was no pop up message to ask if the user would like to delete the job. A pop up box with a message has been added in this release.
Scheduled Reports
- Update to scheduled reports emails with the correct OAG branding and the email body address for OAG has changed to 1 Capability Green, Luton, Bedfordshire, LU1 3LU.
- Bug - Scheduled Report – The rolling dates option in Schedules Analyzer was not working. This has now been fixed.
Maintenance
- Add server name being used by the browser in view-source so that we can see which server is being used.
Analyzer 2.5.3 - Mini Release October 2018
We are very excited to release a new version of Analyzer. This version is a maintenance release including a few bug fixes.
Firstly, we have changed the default chart in results pages to a column chart apart from the Schedules Bank Structure Report which will stay as an area chart. Line Charts are still available using the ‘Modify Graph’ option in the menu at the top right-hand corner of the chart.
In Traffic Analyzer Connections Report, Full Y and Disc Y columns for Estimated Passengers and Avg Fare, First, Business, Premium, Full Y and Disc Y for Average Fare were missing. These existed in the Classic Version of Analyzer
Lastly in DOT Analyzer DB1B Detailed Report we have added Frequent Flyers

Bug Fixes
- If a user ran a report in Analyzer including the map in the results page, then clicked back to run a different report, the map was keeping parts of the original query. This has been fixed.
- All 'Season' options under 'Period' were not working in Schedules Analyzer, this has been fixed.
Analyzer 2.5.2 - Mini Release September 2018
New functionality in Traffic Analyzer: Addition of Load factor, Estimated Revenue Calculation, Pro Rata Fares and Average/Online fare in High Charts
This release contains the following exciting NEW features in Traffic Analyzer:
- Load Factor Calculation
- Total Revenue Calculation
- Pro Rata Fares Calculation
- Average and Online Fares in High Charts
New! - Load Factor
The Segment Report in Traffic Analyzer has been renamed to 'Segment & Load Factor Report' and now includes load factor! Load factor is a metric to show how full an aircraft is. It is calculated using Estimated Pax in Traffic Analyzer divided by Total Seats from Schedules Analyzer.
Load Factor is now available in the Segment tab in the results page of the Segment & Load Factor Report.

Figure 1 - New results page showing load factor for LHR to JFK for the year 2016
New! - Total Revenue Calculation
A new metric called Total Est. Revenue has been added to the Power Table Report in Traffic Analyzer. The current Total Revenue metric calculates revenue by class whereas our new metric Total Est. Revenue calculates using Total Est. Pax multiplied by AvgFare Total. This new metric allows for the data to be manipulated in Excel.
Example - LHR-JFK Jan 2016:
![]()
Total Est. Revenue = Total Est. Pax x AvgFare Total
Total Est Revenue = 119,558 x 890 = $106,361,697
AvgFare Total = 106,364,697 / 119,558 = $890
New! - Pro-Rata Fare Calculation
Two new metrics in the Traffic Analyzer Power Table have been added as part of this release called Pro Rata Avg Fare and Pro Rata Seg Dist Share (%). The current Average Fare metric shows the average fare for a routing including connections. The new metric Pro Rata Avg Fare breaks this down to each flight in a connecting journey using distance and allocates a fare to each flight.
Example - For the routing LHR-LAX-SFO the average fare is $985. LHR-LAX segment accounts for 94% of the total distance and therefore has a pro rata average fare of $927 (985 x 0.94 = $927).
![]()
'Pro Rata Seg Dist Share' metric gives the share of the segment of interest as a percentage of the total routing distance.
These two metrics can only be used with traffic type Segment in the Power Table.
Analyzer 2.5.1 - Mini Release July 2018
New results page, New Analyzer version history, maintenance release for DOT Analyzer and bug fixes for other modules
New Results Page
Results pages in all reports now have a 'My Report' slide out panel at the right-hand side of the screen to show what report parameters have been selected. All results pages also now have a title to show which report is being queried.
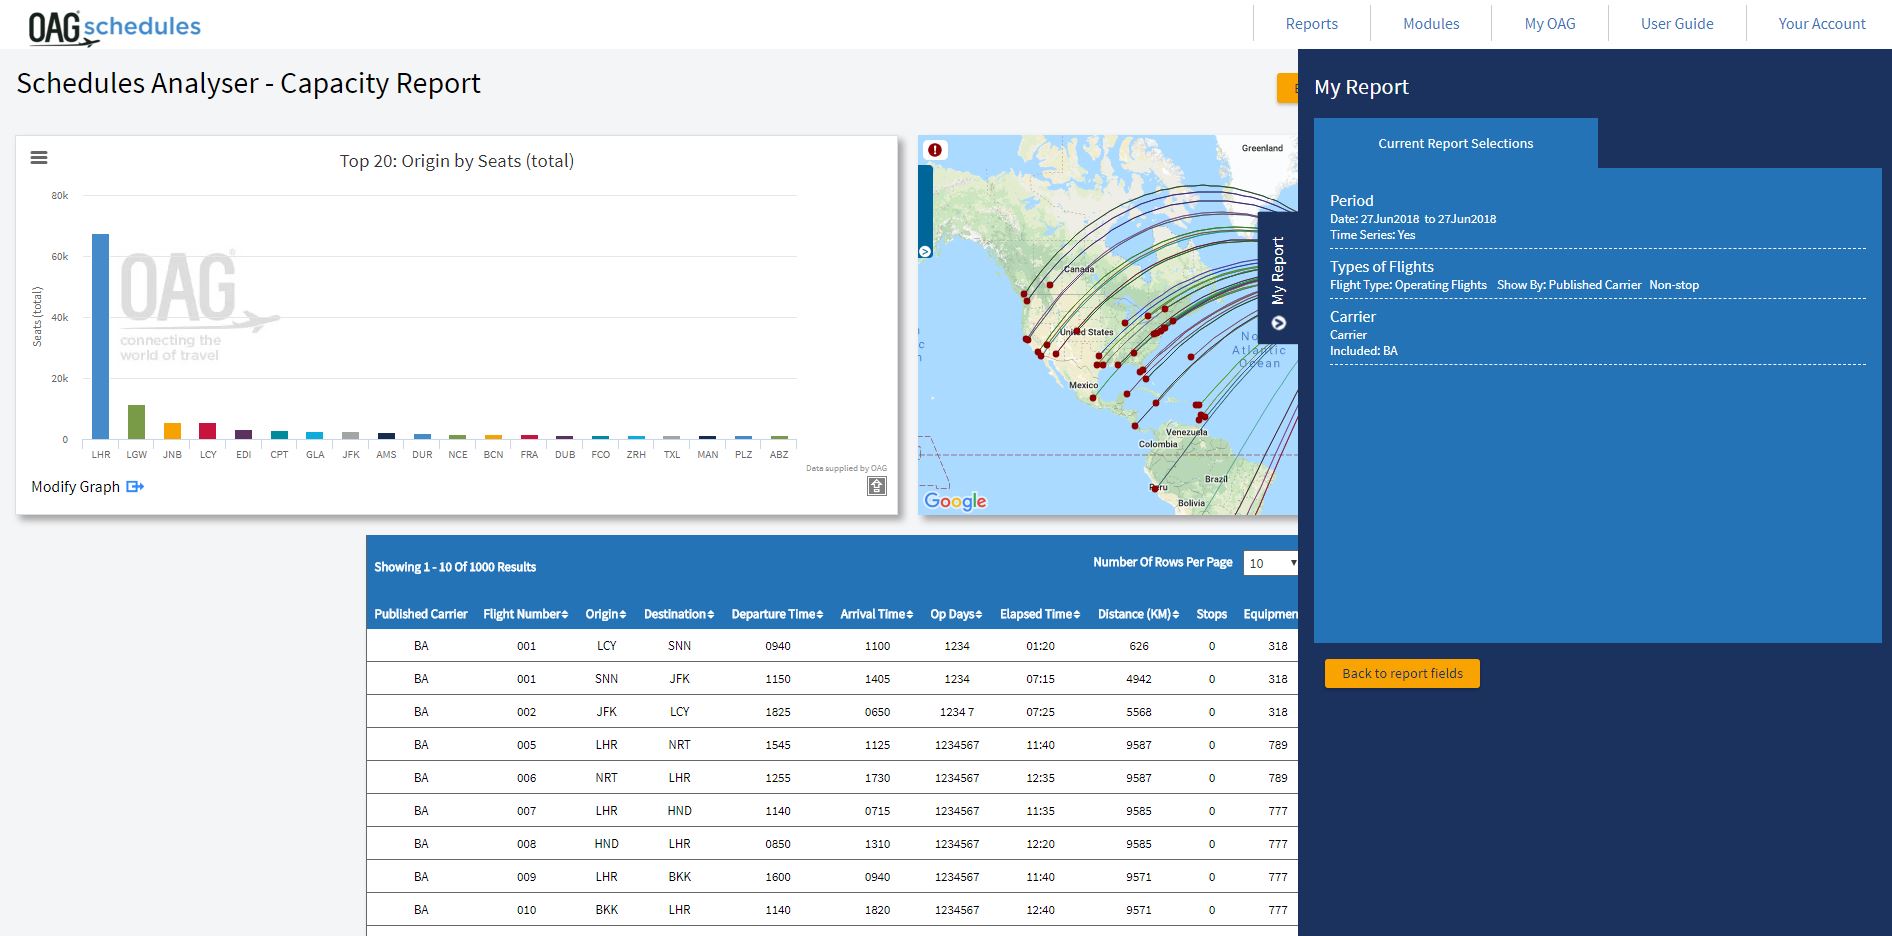
Figure 1 - New results page in Schedules Analyzer - Capacity Report with 'My Report' slide out panel open.
Analyzer Version History
On the Analyzer homepage, we have added a button called 'Version History' which links through to a new web page showing the history of Analyzer. Each new release has a drop down section giving a summary of what has been included in the release. There is a 'Read More' link at the bottom of each section which goes to a new web page with more detailed release notes for that release.

Figure 2 - Screenshot of Analyzer home page with 'Version History' button
Analyzer 2.5 - New Version of DOT Analyzer Released!
The new DOT Analyzer enables users to quickly analyze US DOT data to look at passenger and capacity trends, average fares and measure financial performance
DOT Analyzer is the final module of the Analyzer suite to be given the new Analyzer look and feel. As part of this
New features include:
- Easily view all possible input parameters
- Report selections automatically appearing on screen
- 6 Power
Tablee Tree structure for dimensions and metrics to easily choose required fields- Combined T100 Domestic and International data to easily analyze both
- New 'Data Overview' button to see when the data has been updated
- Addition of Job Bin functionality to run multiple reports at the same time
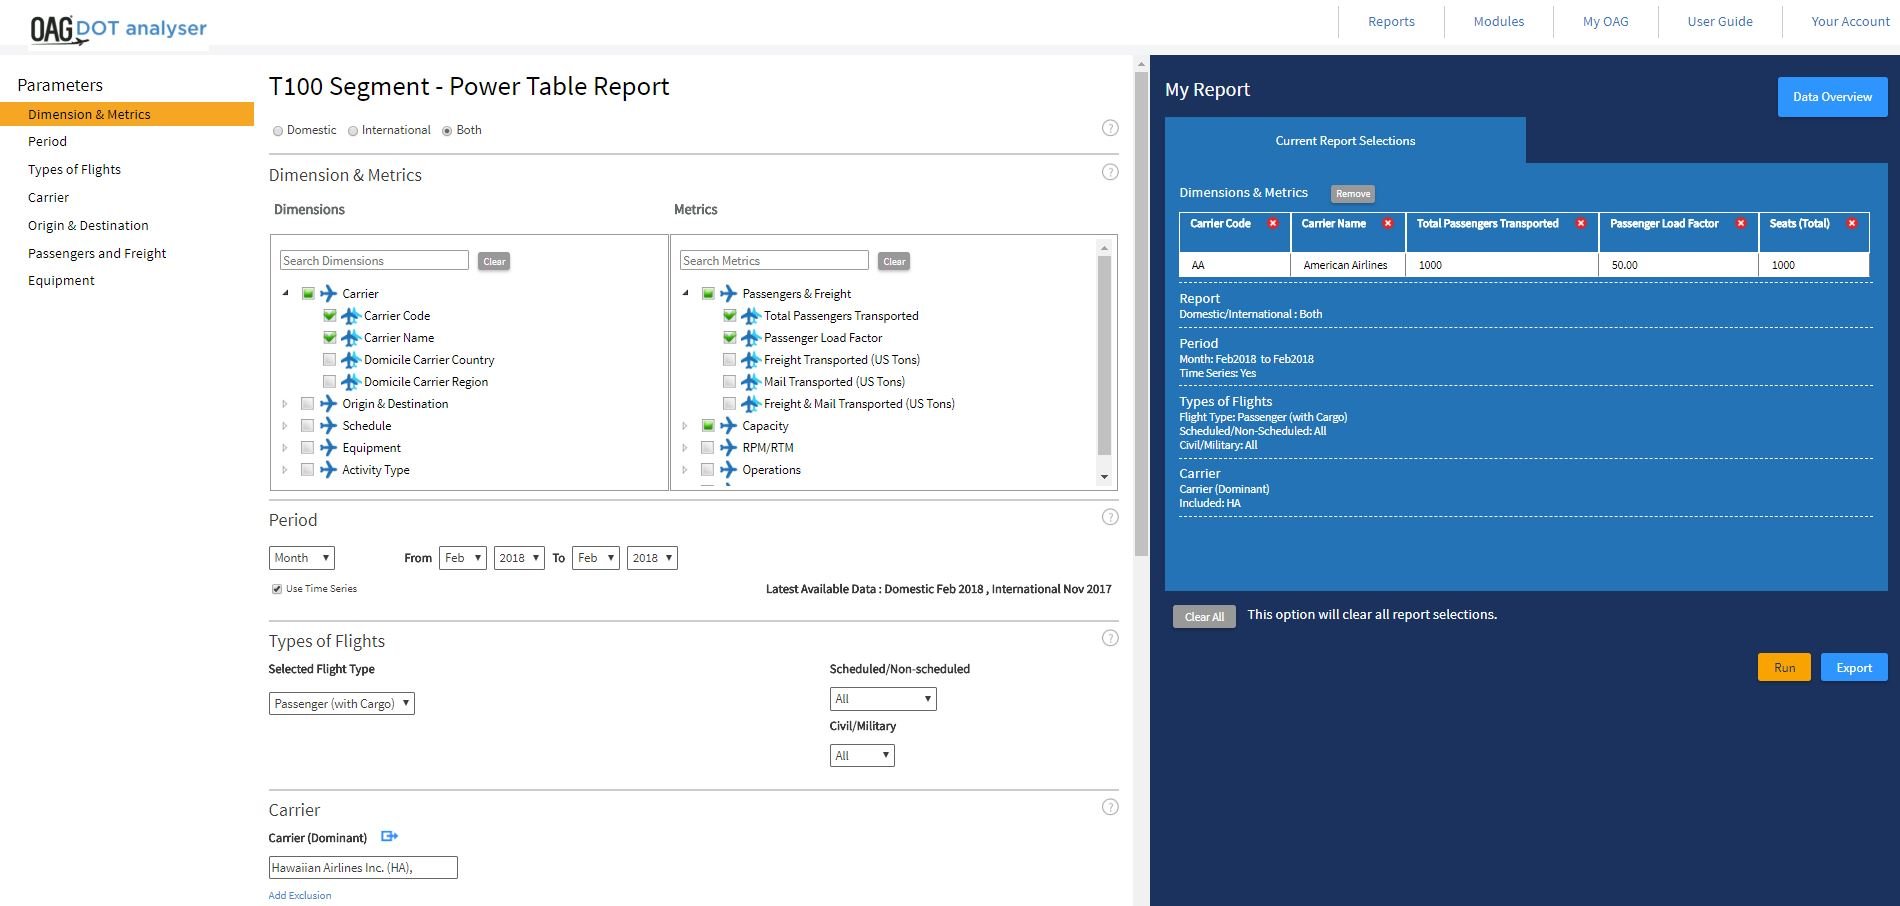
Figure 1 - T100 Segment Report Page
Analyzer 2.4.2 - Mini Release May 2018
New functionality for Mapper and bug fixes for Connections Analyzer
New
We received a lot of feedback from customers about being able to drag and drop labels in Mapper so we have developed this functionality as well as being able to cluster labels together.
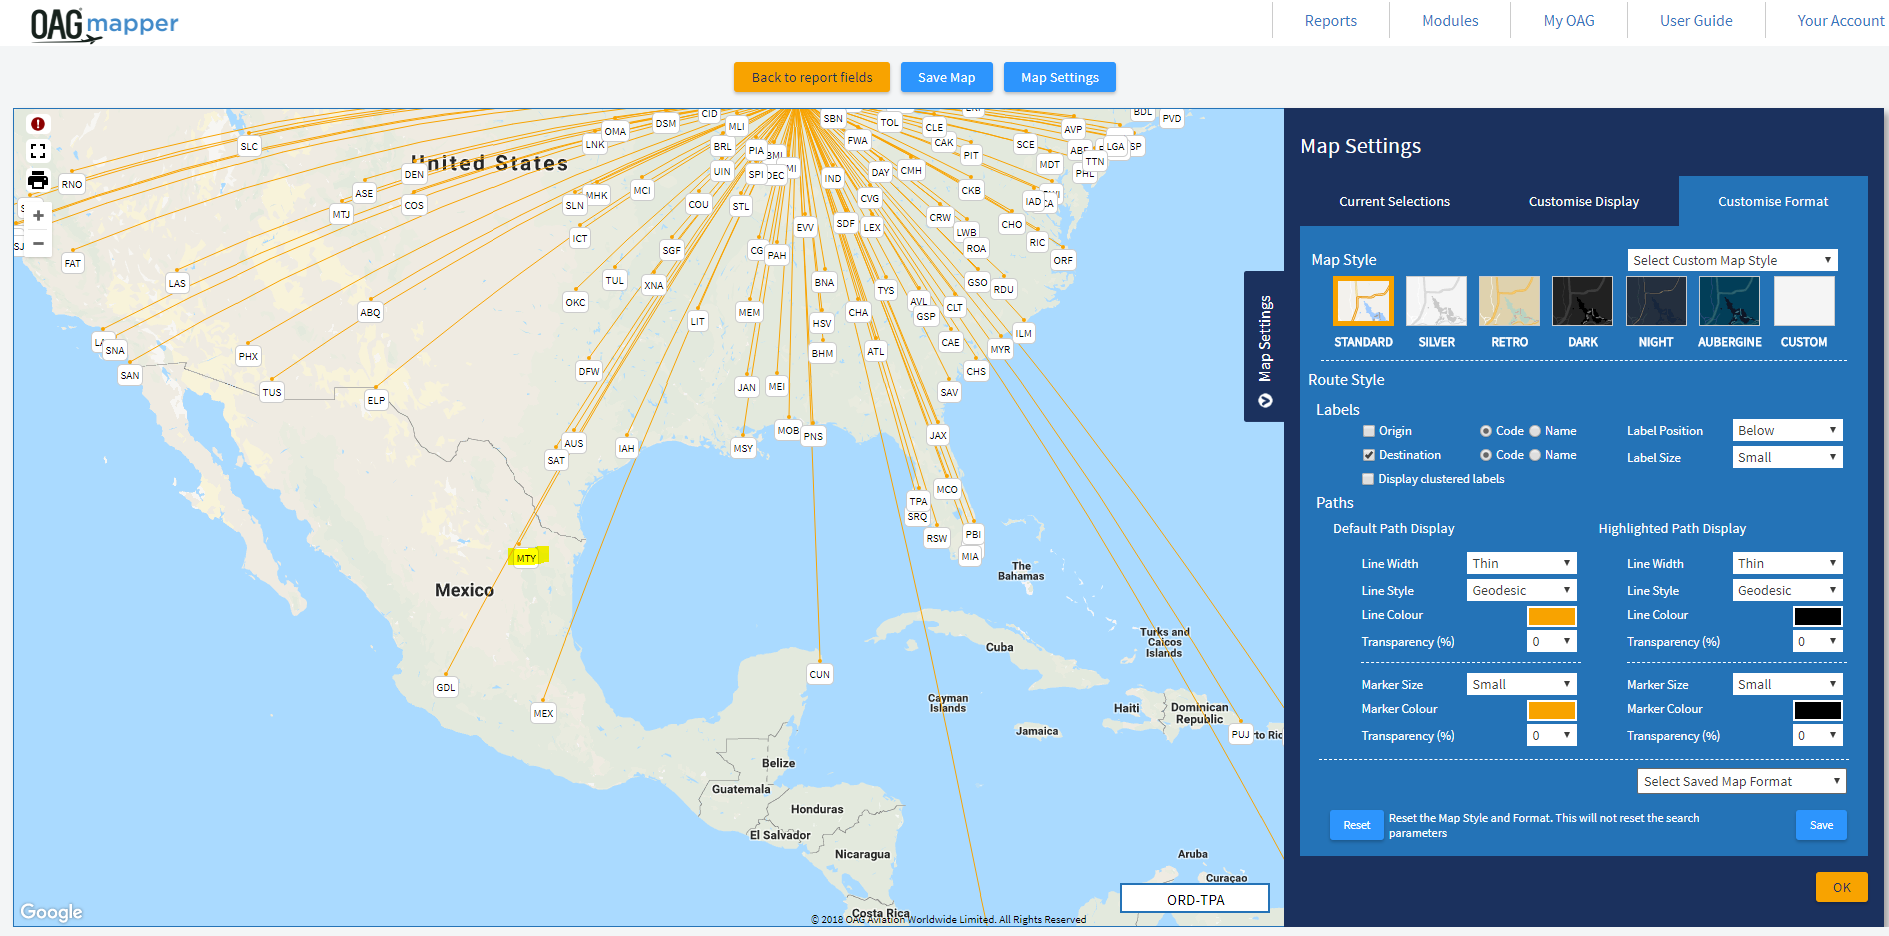
Figure 1 - Mapper output before moving MTY, GDL and MEX
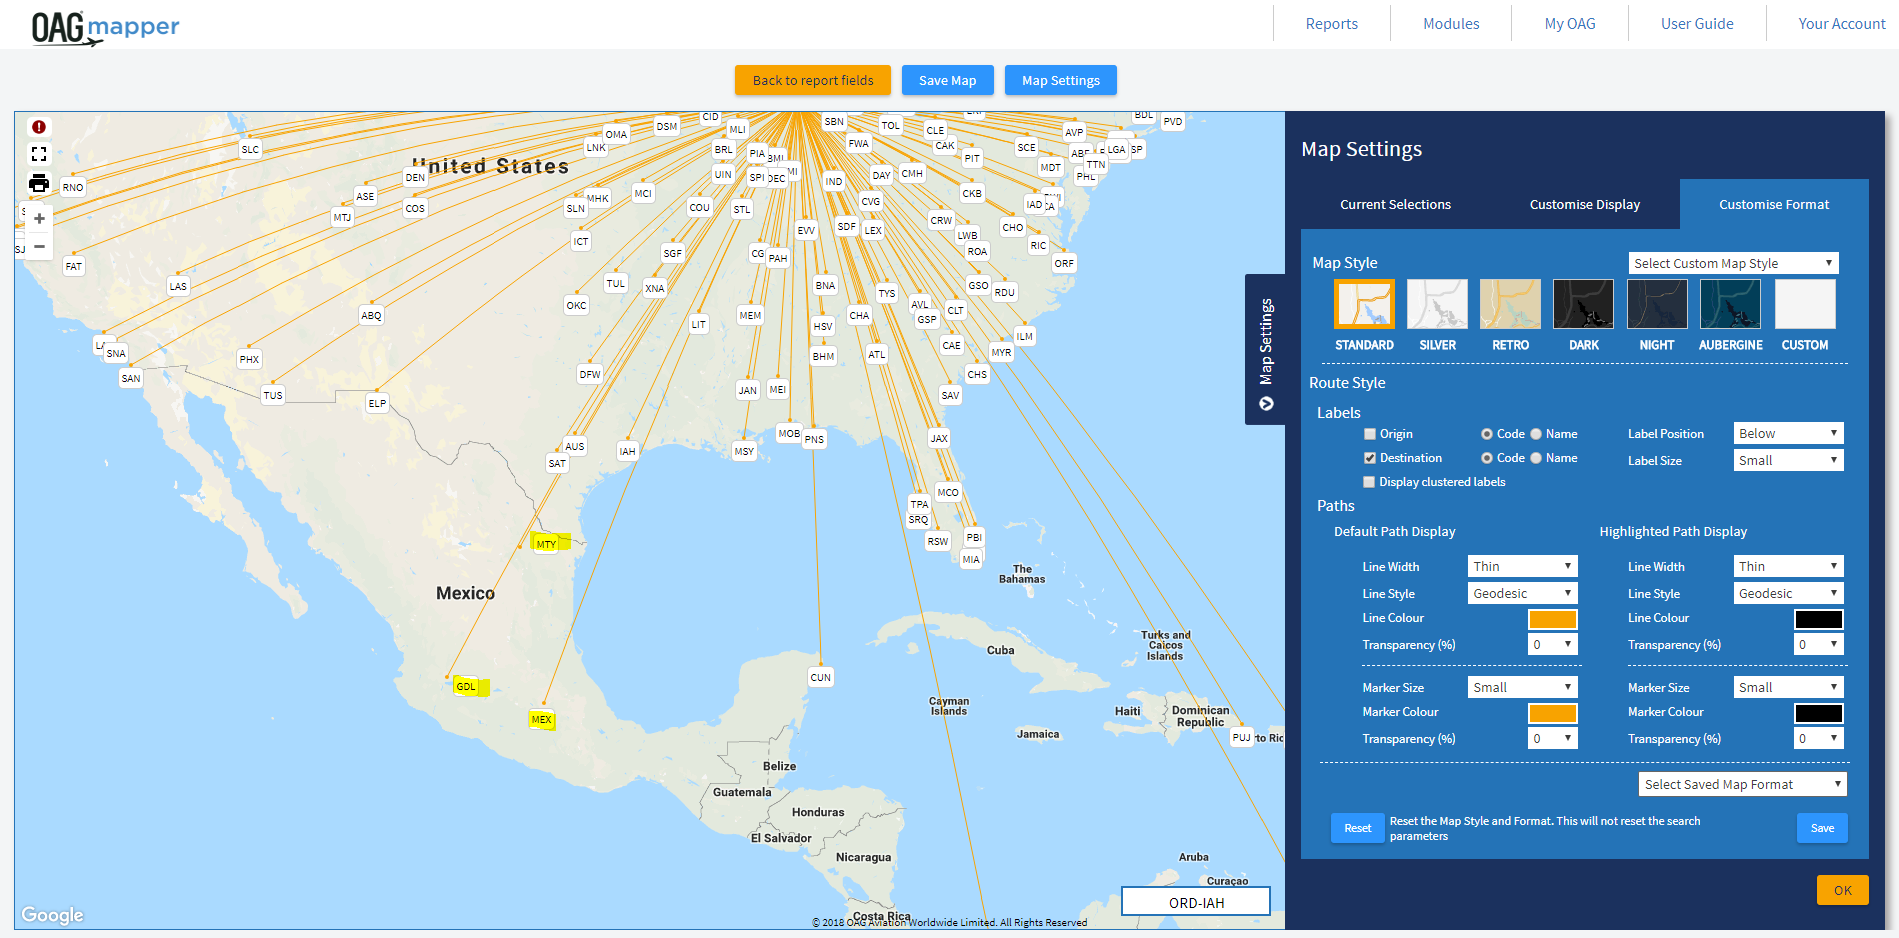
Figure 2 - Mapper output after moving MTY, GDL and MEX
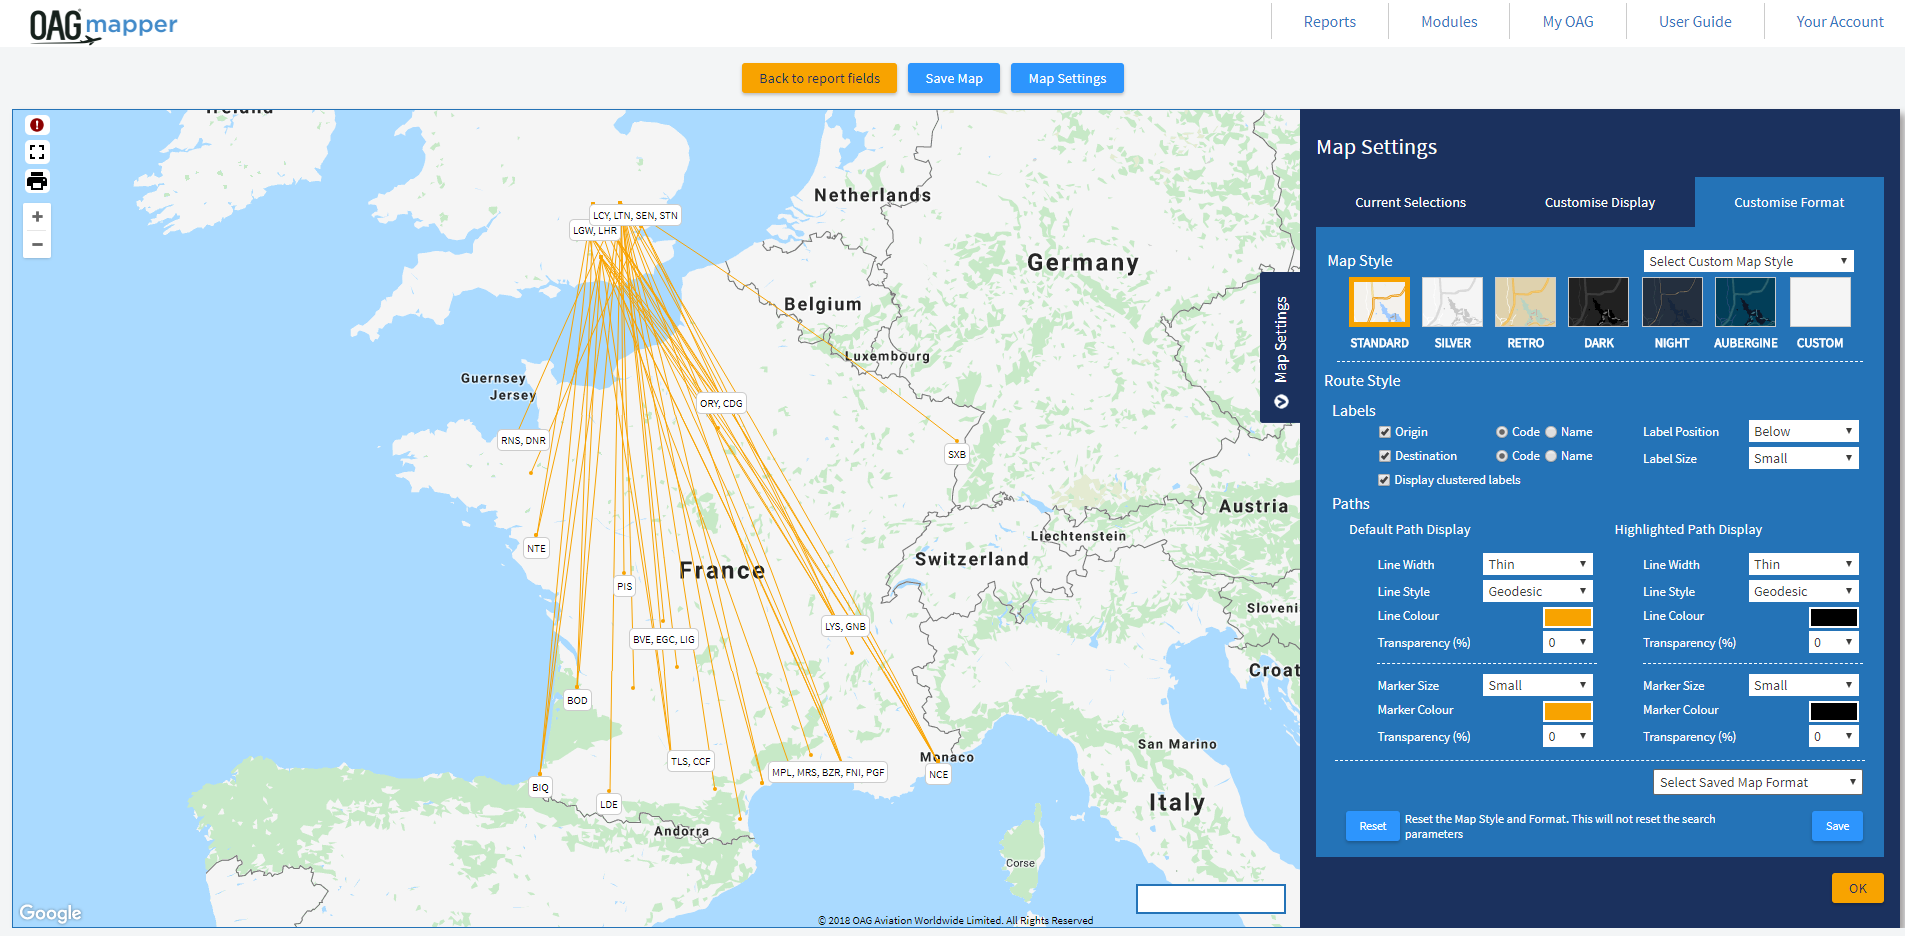
Figure 3 - Mapper output clustering labels
Bug Fixes in Connections Analyzer
- After uploading a CSV phantom flight file that has terminals in them, when reviewing the flight in the edit panel the terminals were showing 0 instead of a value. Fixed.
- ‘Select All’ still showing as checked on QSI edit panel when just a few QSI coefficients had been chosen. Fixed.
- Effective dates on phantom flight edit panel showing previous day’s date after save and then reopen. This is to do with the timezone of the browser. Fixed.
Analyzer 2.4.1 - Mini Release March 2018
Analyzer maintenance release
Bug fixes for the Analyzer suite.
All Analyzer
- Sort columns in results table was not working, this has been fixed.
Mapper
- Mapper color picker pop up position fixed for IE/older browsers. Was appearing half outside the browser window.
- Passenger/cargo dropdown picker added to Mapper parameters.
- Mapper regions now hardcoded to WW1. Was using Schedules Analyzer region setting but will not work if only subscribing to Mapper as no region set.
Connections Analyzer
- Fix for period dates on Connections Analyzer - saved/load reports not loading correctly.
- Phantom Flights elapsed time / arrival time / arrival day calculation now fixed for airports such as CCP – IQQ.
Traffic Analyzer
- Period picker not showing latest Prelim travel date. Was wrong year. Now fixed.
Schedules Analyzer
- Schedules Analyzer Capacity Report now returning data for pre-2005 when Flight Type set to Both. It was failing before.
Analyzer 2.4 - It's here! All New Mapper Module!
Now using Google maps, this intuitive and powerful mapping and marketing tool now lets you plot and customize route maps with ease
- Access rich historical data and full future data in OAG's schedules database with over 900 airlines
- View existing routes and 'custom' routes in one map with new query options
- Plot unserved routes
- Use the new range functionality to highlight opportunities
- Match your corporate colors to stay on-brand with rich customization options
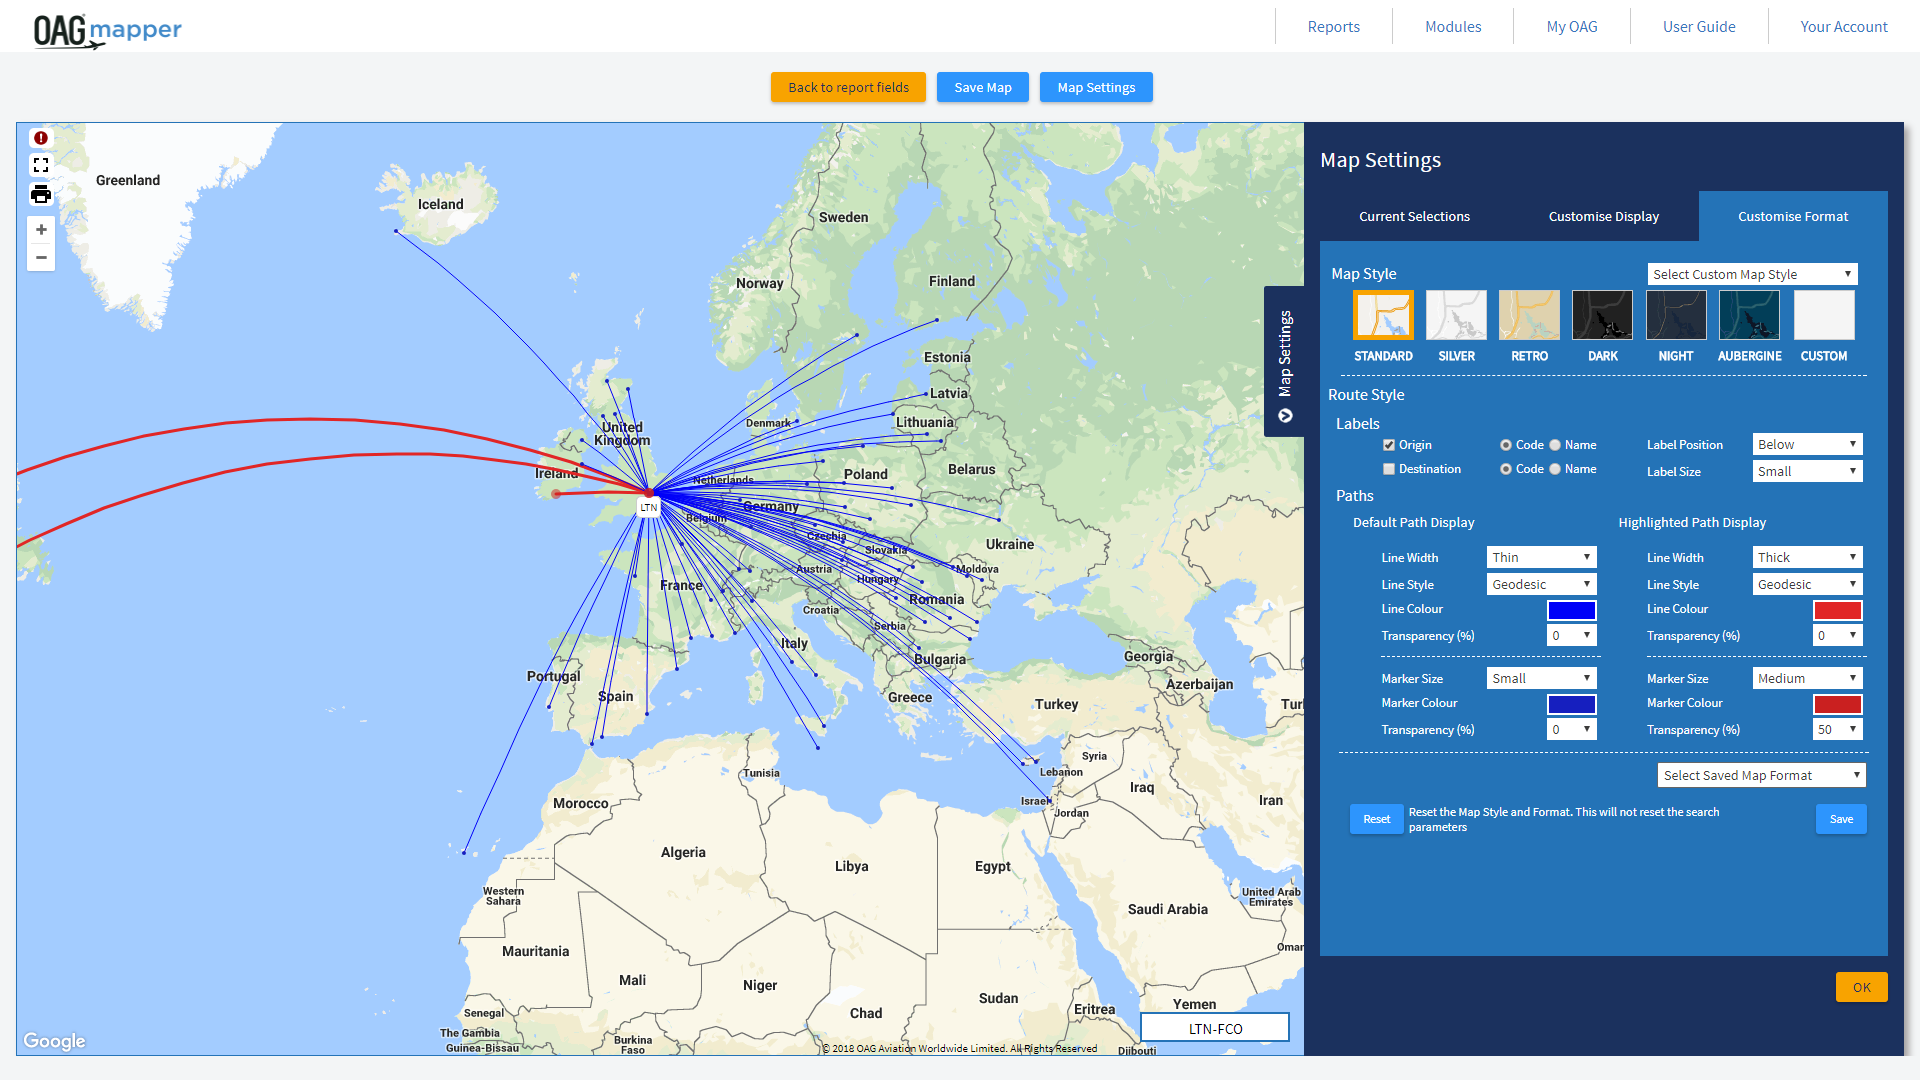
Figure 1 - New Mapper Screen and Customize Options
Analyzer 2.3 - New Reference Data Module!
All new Reference module in Analyzer is now here
As part of the Next Generation Analyzer Suite we have created a new Reference module in Analyzer to bring all our reference data together in one place:
- Eight standard reference reports
- Two Quick Reports 'Airport Terminal' and 'Airport by Carrier'
- Integration of mapping within Distance Calculator
- Multiple routing comparisons in Distance Calculator using circuity calculation
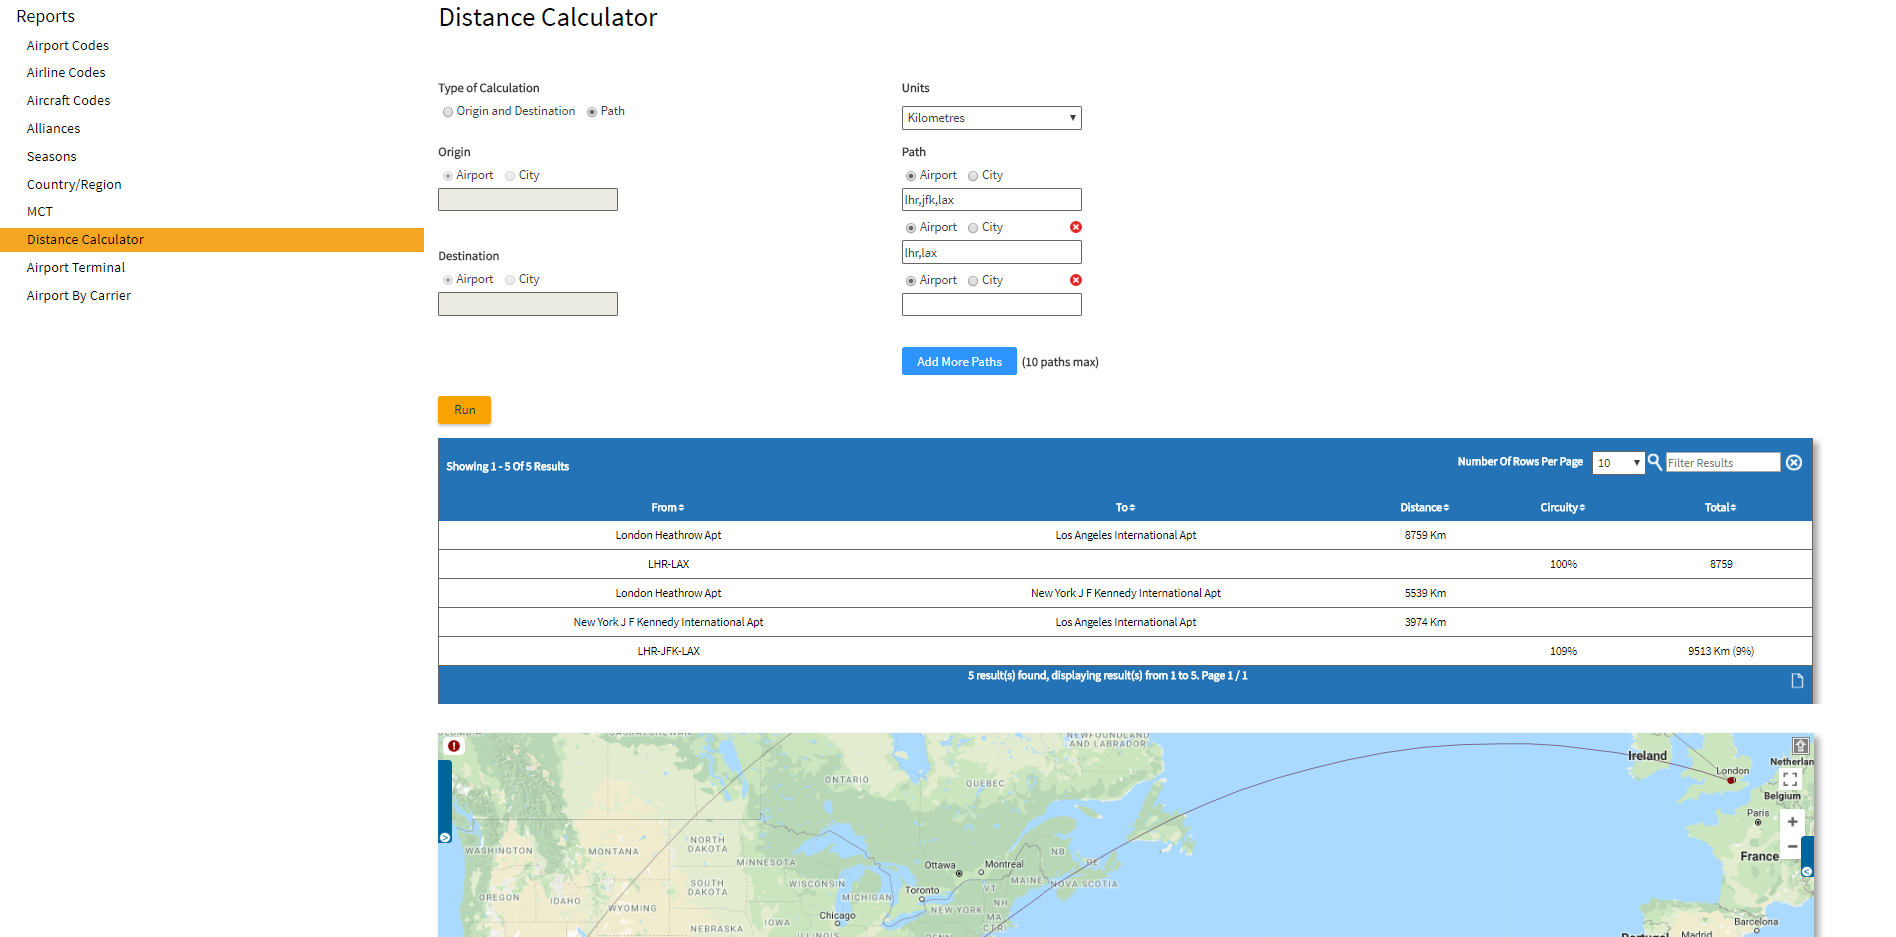
Figure 1 - Distance Calculator output including Google maps and circuity calculation
Analyzer 2.2.1 - Mini Release October 2017
Maintenance Release for Connections Analyzer
Bug Fixes for Connections Analyzer
- Selecting Doubles only from Trip Type. Validation error no longer blocks this selection.
- Tool tip styling on Connection Parameters.
- 0000 and arrival day marker showing 1 on Phantom Flights for UK port such as EDI. Now correctly shows as 0.
- Calendar drop down end-year showing as 2017 for all subscribers. Calendar drop down now fixed to end current year + 1, e.g., 2018.
- Users that only subscribe to CA are unable to run reports. Users who subscribe to other modules along with CA can use it ok.
- When a user selects directs and doubles, Connections Analyzer only produces directs and singles.
- Ensuring year 2018 comes out in the drop down list for users who just subscribe to Connections Analyzer.
- When month is selected as the period type and the year 2018 is selected in CA, the year 2018 now appears on the report page correctly when a job is opened from the Job Bin. Previously it was loading as 2017.
- Advanced carrier selections not loading on report page when job opened from Job Bin.
Analyzer 2.2 - New Version of Connections Analyzer now live!
A new simple screen and improved interface with enhanced functionality to model phantom flights
Connections Analyzer is the third product to be given the Analyzer new look and feel including enhanced functionality to model phantom flights.
New features include:
- Easily view all possible input parameters
- Report selections automatically appearing on screen
- Interactive graphical options make Connections Analyzer data simpler
- Customize and configure output to your specific needs
- Utilize enhanced functionality and logic to model your Phantom flights
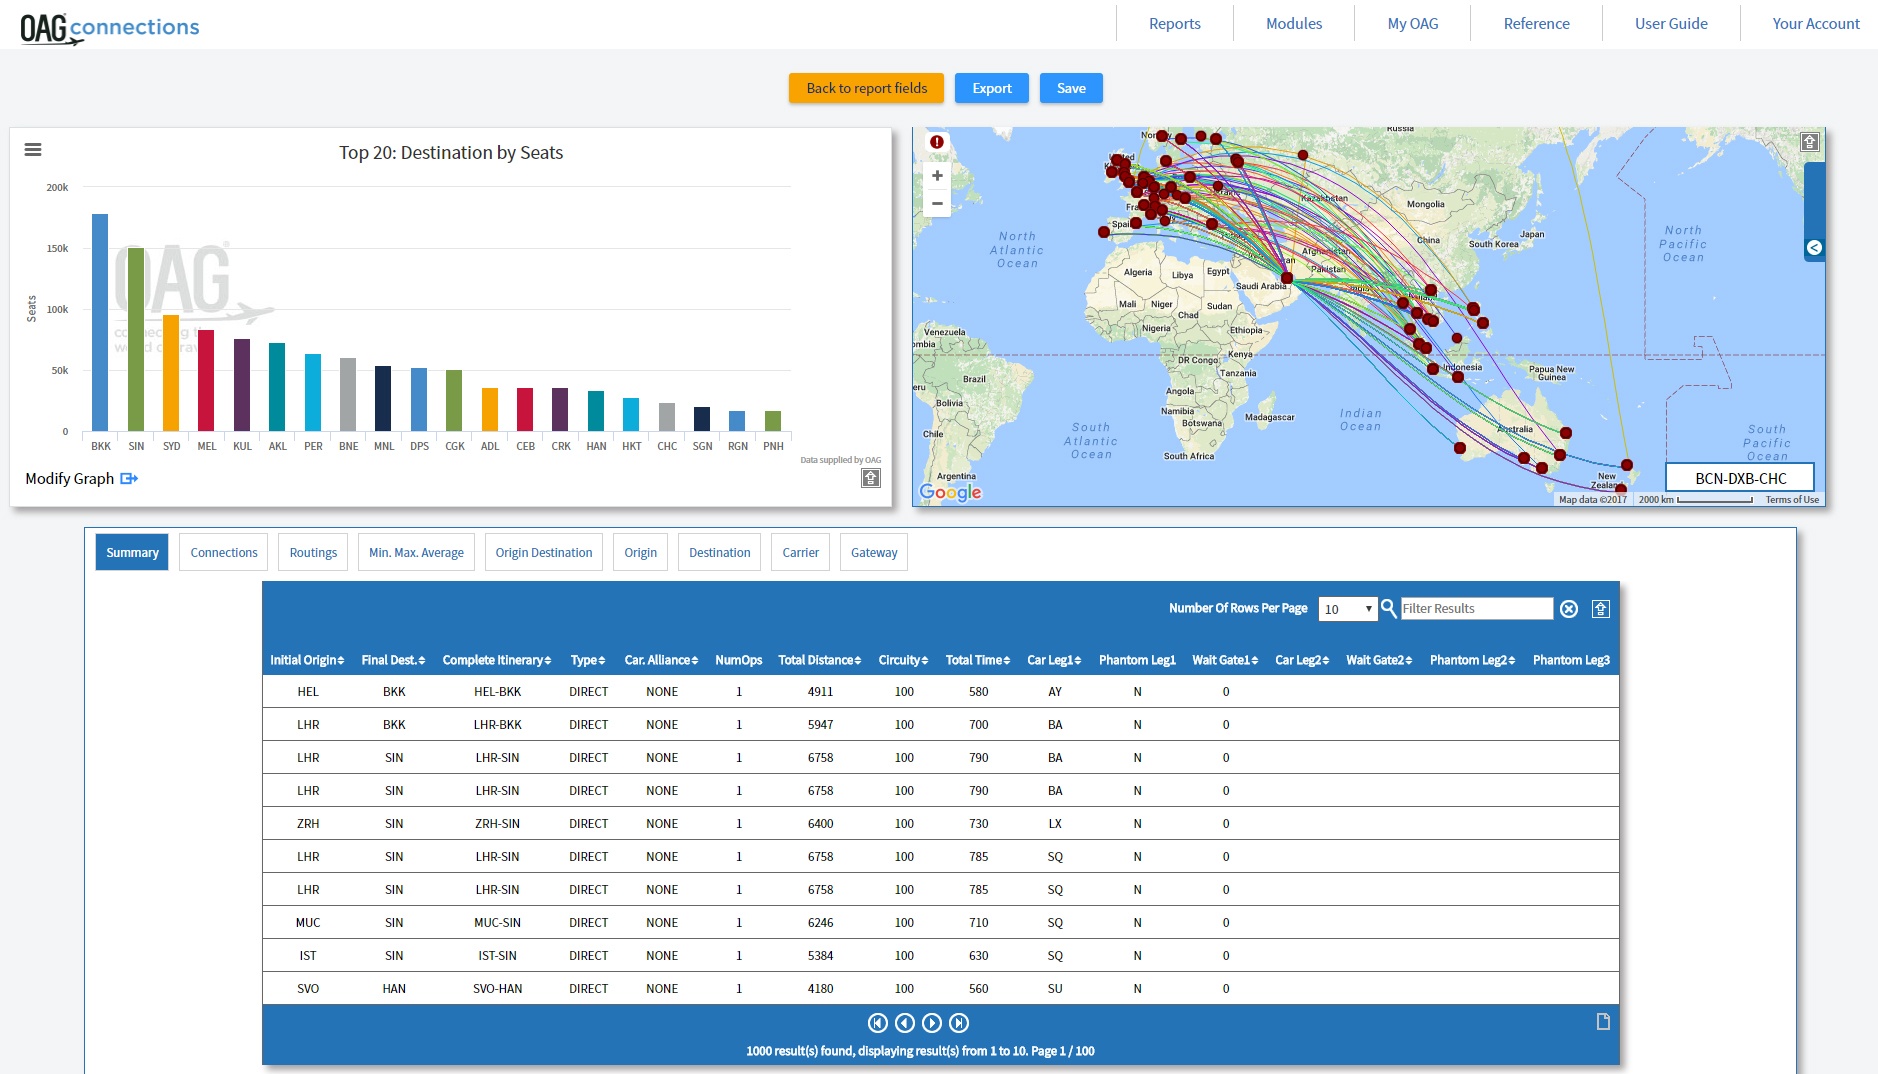
Figure 1 - New Connections Analysis results page
Analyzer 2.1 - New Traffic Analyzer is now live!
All new look Traffic Analyzer is here including a new look and feel, and improved fares
Next Generation Traffic Analyzer is now live with a new look and feel, improved interface, increased functionality and improved fares. Traffic Analyzer is the second product to be given the Analyzer new look and feel.
New features include:
- Graphical options make Traffic Analyzer data simpler
- Standalone Segment report – this was previously part of the O&D report
- Online fare data for Europe, Middle East and Asia Pacific Airlines
- Weighted average fares for 56 airlines
- Historical monthly data to January 2015
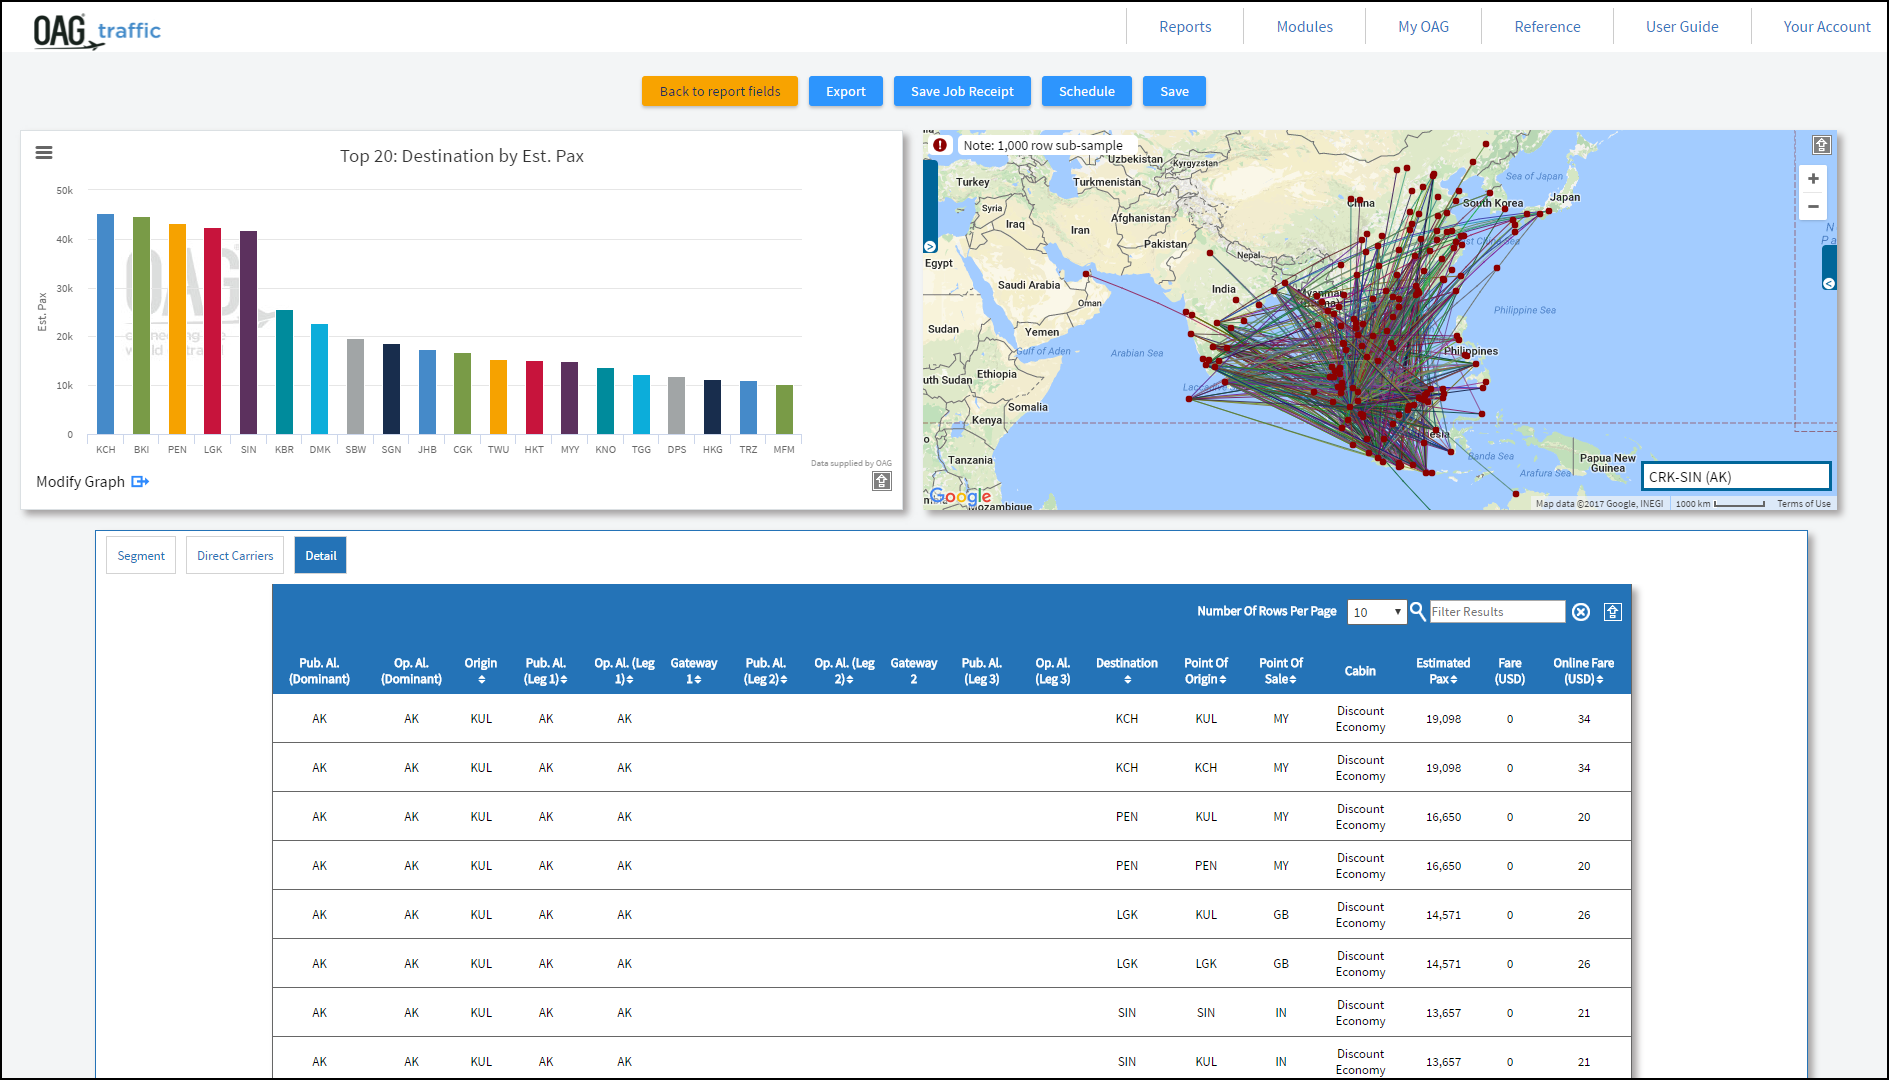 Figure 1 - New Traffic Analyzer results page including new online fares column
Analyzer 2.0.1 - Mini Release April 2017
Maintenance Release for Schedules Analyzer
Bug Fixes for Schedules Analyzer
- Period / date picker (lose focus) – retain selection when not clicking away from entry box
- No map message – error message when map does not display
- User preferences in IE11 formatting – across rather than down page
- Arr city name – misconnect with reference table
- Polling issue – remove / rearrange code to phase results ping
- Purchased years / regions messaging – information on home page
re subscription Powertable – moving column selections when customizing table returns ‘undefined’ in IE- Equipment group not updating parameters once selected
- O&D pairs when uploading to custom box – cursor defaulting to next line and report looks for airport or airport pair
- Regions URL issue – customers with select region version require minor code change to deliver reports
- IE11 caching – F12 open allows reports to run, edit code for IE11
- Session connection ping – lengthen period for checking
- JDBC connections issue
Analyzer 2.0 - Next Generation Analyzer goes live!
Schedules Analyzer now has a new fresh look and feel with a simple screen and improved interface
- Easily view all possible input parameters when running reports, such as airline capacity, bank structure, changes, power tables and custom reporting
- Run reports without having to see the information you do not need
- Your report selections now automatically appear on screen so you can check the criteria as you work
- You can now easily select the report columns you need with configurable columns on all reports
- New graph options
makes analyzing data simpler. Ready-made visuals are now at your fingertips! Eye-catching graphs and maps powerfully illustrate your analysis for presentations and other business documents.
Figure 1 - Schedules Analyzer new home page with Job Bin, Saved Reports and Scheduled Reports
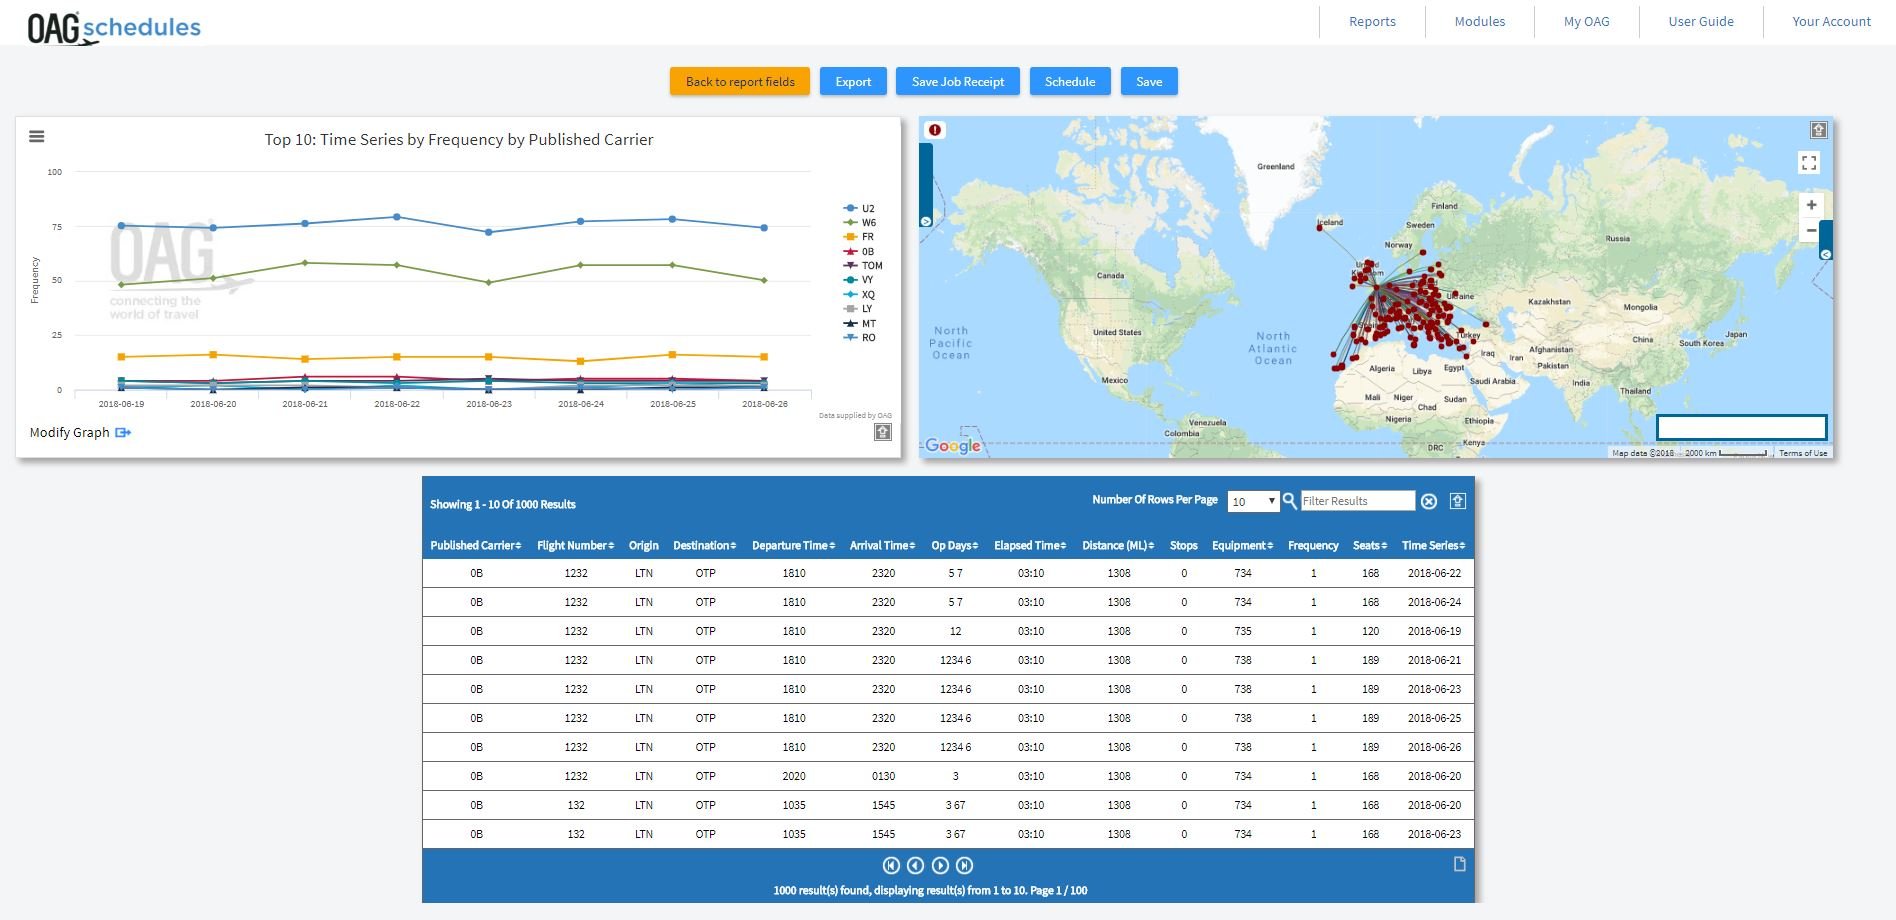
Figure 2 - New Schedules Capacity Report results page including new graph options, map and results table
Analyzer 1.0 released!
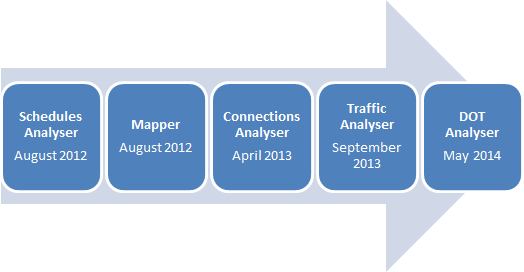
Classic Schedules Analyzer went live in August 2012 with Connections, Traffic and DOT Analyzer following
Classic OAG Analyzer Timeline


.jpg)


.png)


