TRAFFIC ANALYSER

RESOURCES, HELP AND TRAINING

Understanding air passenger traffic demand across markets leads to more accurate route planning, forecasting and competitor analysis.

Use this tool to interrogate airline passenger statistics, as well as analysing and predicting demand and supply in different markets around the world. 

This powerful platform helps you forecast traffic for new airline routes and model the economic impact of adding them to your schedules.

Using MIDT data (Marketing Information Data Tapes) our 'passenger traffic' stats are based on GDS bookings data and underpinned by OAG’s schedules database.

Our Traffic module provides essential insight around airline route data, including the following reports:

Origin & Destination Report: Bookings and average fares on a given origin-destination with up to two connections.

Segment and Load Factor Report: Bookings, load factor and average fares for flights on a given direct origin-destination route.

Power Table Report: Fully-customised report of passenger booking and average fare data.

Mix Report: Bookings and average fares for flights on a given direct origin-destination route, broken down by traffic type: local, behind, bridge and beyond.

Connections Report: Bookings and average fares by cabin for flights on a given origin-destination through a specified connecting airport.

Top X Report: Top carriers, top departure/arrival airports, top routes, top hub airport and top point of sale based on various criteria (bookings, cabin types, total revenue, average fares).

READ MORE
bg7

Latest Release : AnalyZer 2.7- Mini Release June 2022

  • Times series – We have changed the format of the time series so that your exported date data retains its structure and does not require you to do any further formatting.

  • Airline and Airport Hover – Integration of reference data on a hover pop up; This allows the display of detailed Airline and Airport information without the need to run a separate report.

Find out more

How to videos

HubSpot Video

See Whats New In Traffic 


HubSpot Video

Discover Traffic 

HubSpot Video

How To Run O&D Reports 

HubSpot Video

Understanding The Mix Report 

HubSpot Video

Using The Segment Report 

status-icon

USER Guide & Documentation

Download supporting documentation using the links below:

schedules-icon

Get in Touch

Contact Support For Additional Help 

FAQs

We recommend customers use Google Chrome. OAG Traffic Analyser can be slow or not show correctly on some browsers.

The ‘Adjusted Preliminary’ data is loaded on the second weekend of each month and covers travel data for two months prior to the current month.

The ‘Adjusted Final’ data is loaded on the third weekend of each month and covers travel data for four months prior to the current month.

‘Unadjusted’ data is loaded on the second weekend of each month and covers travel data for two months prior to the current month. It also contains data for 12 months in the future.

OAG Traffic Analyser data is sourced from our partnership with Travelport and is comprised of many different data inputs including MIDT. Unadjusted bookings data is MIDT-based, while the average fare data is derived from Travelport issued tickets. Adjusted data for bookings is a modelled dataset that estimates the true total market figure. The model takes capacity, load-factor, MIDT, and various other external datasets as input and runs them
through a series of sophisticated proprietary algorithms to arrive at its estimates. Average fare data is still derived from Travelport issued tickets. The ‘Adjusted preliminary’ data is a draft version of the adjusted data as some of the external sources used in the model are not available yet. The ‘Adjusted final’ is the final version using all sources.

No, the selections you make are simply ways to narrow down the data to meet your requirements. For instance, if you select no carrier, the query pulls data for all airlines. Similarly, if you select no time period you will be extracting data from the entire OAG Traffic Analyser database. Obviously, to make analysis quick and meaningful it helps to carefully select only the data you need.

If you have selected a large amount of data, the query will take longer than if you select a small volume of data. Make sure you have defined the data required as precisely as you can.

OAG Connections Analyser requires a lot of computer processing, even for relatively small queries and reports. If your query includes a long time period, or double connections, this significantly increases the amount of processing required. Any report which takes over an hour to process is timed out by OAG Connections Analyser.

Selecting ‘one-way’ returns data from a specified origin to a specified destination only. ‘Twoway’ returns data for the same route, or origin-destination pair, but shows the data from the origin to the destination, as well as the destination to the origin as two separate records.

The O&D is the airports at the start and end of the route booked by the passenger, i.e. the origin and destination airport. Each non-stop flight taken is a flight segment. A passenger who connects at one or more intermediate airports will have several segments associated with their O&D.

The data sources for adjusted bookings and fares are different, but related. While Adjusted Bookings come from a modelled dataset that estimates the true total market figure, the fare data is supplied by Travelport only. Occasionally the adjusted bookings data gives a figure close to zero which OAG Traffic Analyser rounds down to zero, while the Travelport data may have a nonzero fare. Where Travelport has no fare data OAG Traffic Analyser reports the fare as zero.

The average fare excludes taxes, fees and fuel surcharges, but does include commission payments. Non-revenue tickets are excluded from the calculation. Data is supplied by Travelport in USD.

While schedule data has consistent patterns by day of week, airline traffic data does not. In order to make analysis meaningful, data is aggregated to a minimum period of one month.

It doesn’t matter. You only need to select one of the names as Analyser pulls all the data by code as long as the code is the same.
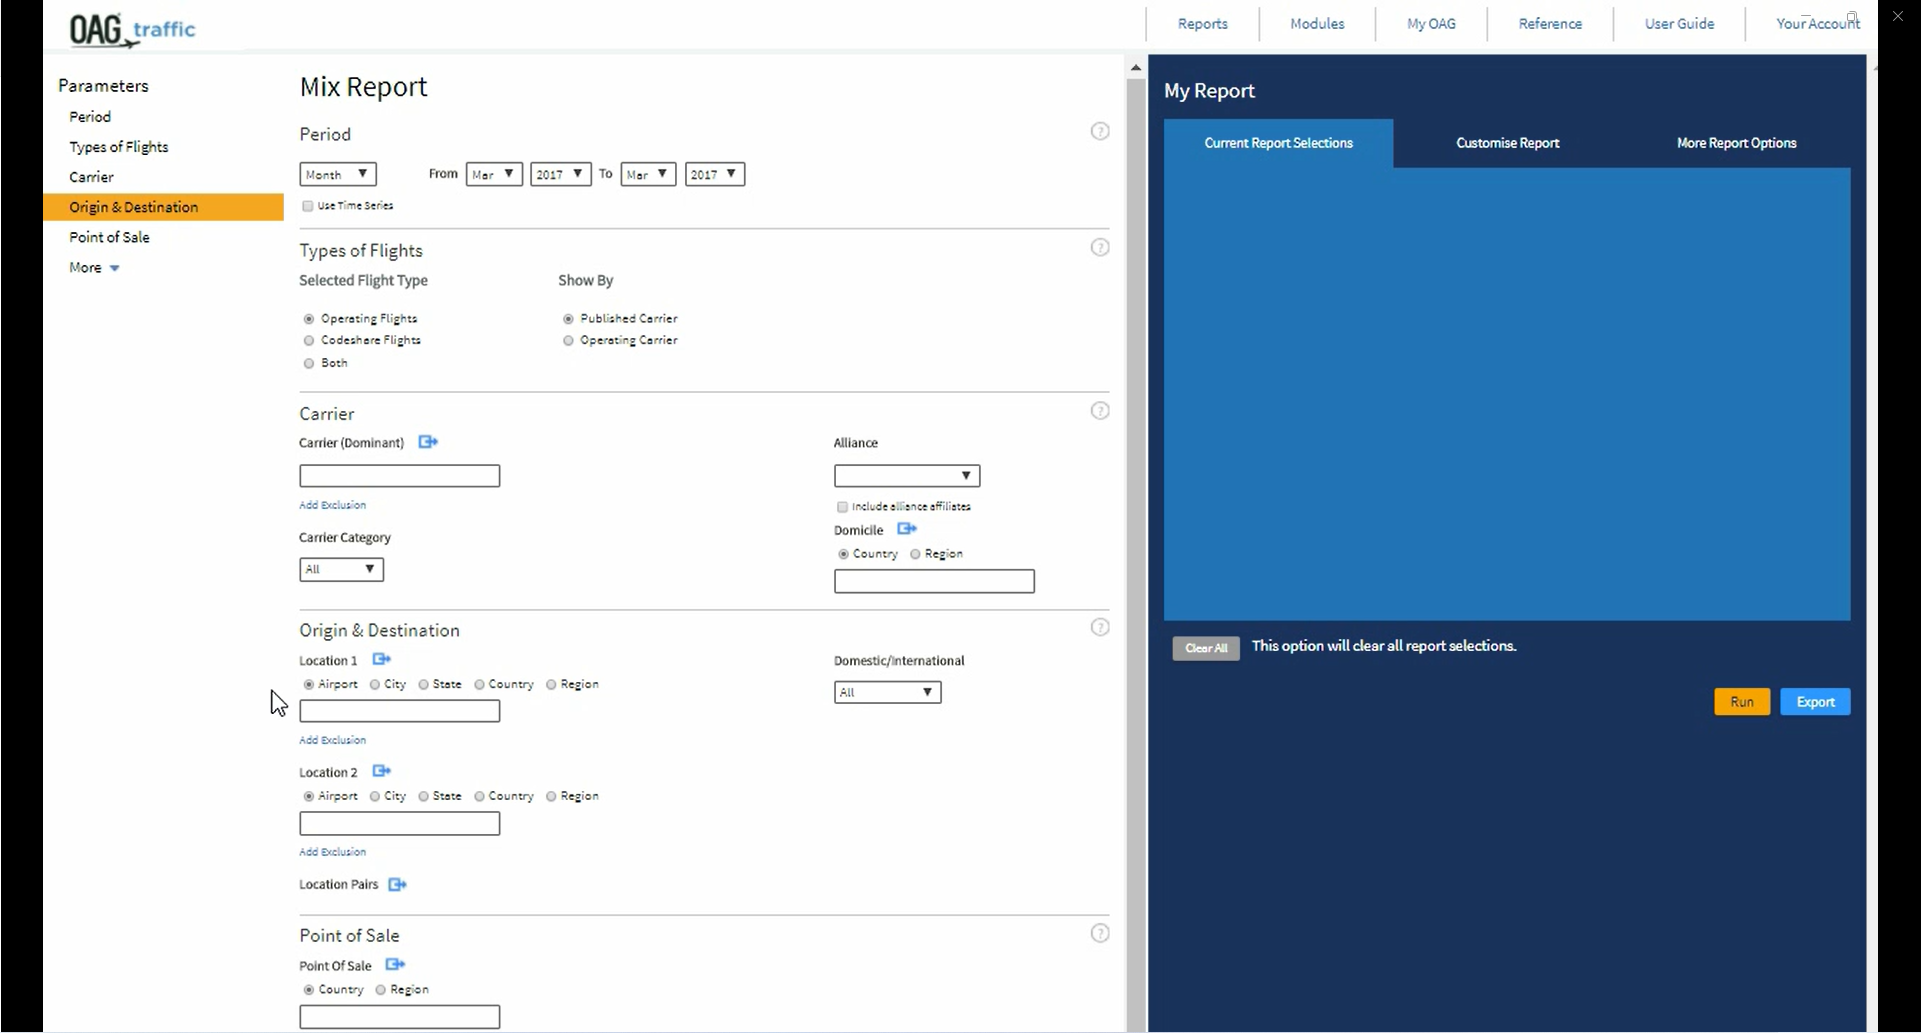
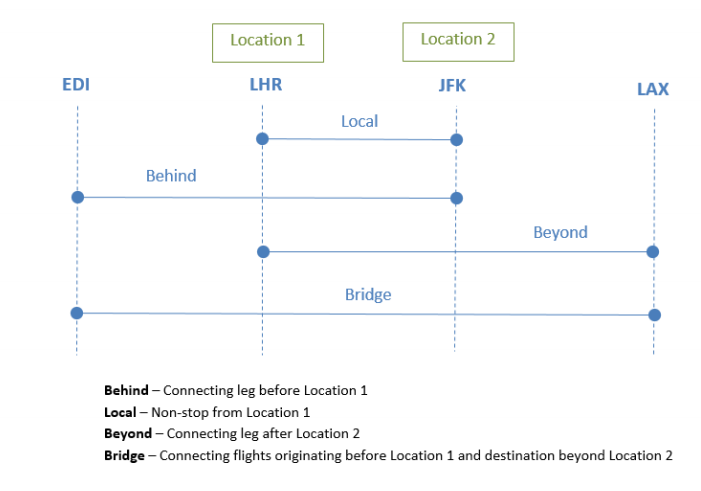
The ‘Mix’ is the combination of the four types of passenger journeys represented on a single flight segment. These are ‘local’, beyond’, ‘behind’ and ‘bridge’ traffic.
− ‘Local’ traffic means those passengers flying non-stop on the flight segment.
− ‘Beyond’ traffic means those passengers flying onwards from the non-stop flight segment to another destination i.e. they take a connecting flight.
− ‘Behind’ traffic means those passengers who connected from another flight before travelling on this non-stop flight segment.
− ‘Bridge’ traffic means those passengers who connected onto this non-stop flight segment and will connect again onto another flight.
The diagram below illustrates each type of traffic.
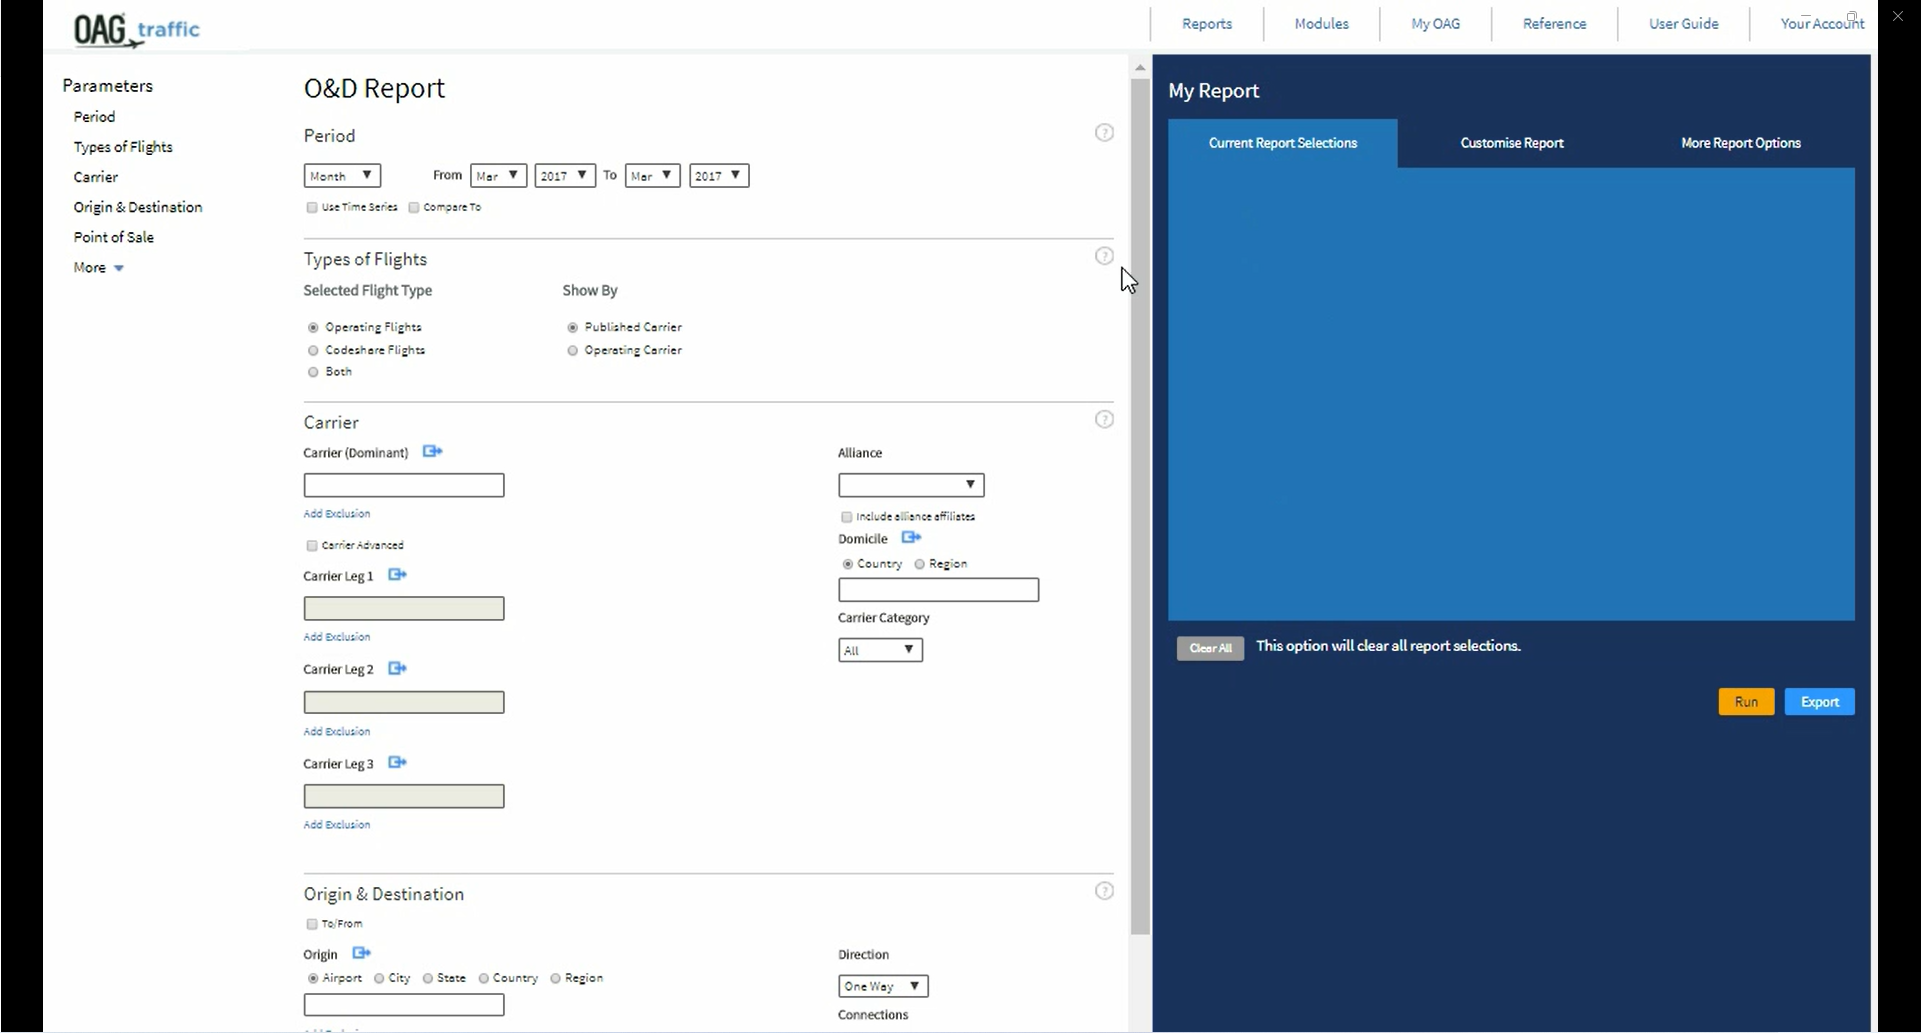
7-5-2017 3-09-17 PM.png

The Point of Origin for a booking is the place where the passenger started their journey. This means that it might be different to the ‘Origin’ for the flight segment(s) as the passenger might be travelling on the return leg of a booking.

Each tab is calculated separately and sometimes numbers are rounded at different points in the calculation which means the numbers may not match exactly.

When you specify a carrier in a query in Traffic Analyser the default search presumes that the carrier is the dominant carrier on the routing, i.e. that the carrier is used for the longest leg of the routing. The Advanced Carrier function allows you to over-ride this and identify a specific carrier for any leg of the routing. This is especially useful when analysing traffic feed on short domestic sectors which feed long haul routes.

Traffic Analyser now includes a feature which allows the user to identify unserved routes.These are routes where there are passengers travelling between two points via connecting airports but there are no direct air services.

No. You are just logged out of the individual product but still logged on to the OAG Analyser dashboard (portal). If you are inactive on Traffic Analyser for 1 hour your session will timeout. Within the dashboard the inactive timeout is 12 hours. One user can have only one active session in the dashboard or Traffic Analyser at a time.