
Will Hero Joe Come to the Rescue?
Marginal reductions in global capacity this week as always hide several regional adjustments in capacity as the seasonal holidays in some countries finish and authorities in some countries impose or threaten another series of restrictions. The inconsistencies in various travel restrictions imposed around the world continue to make no sense and confirm that geography was not a subject covered in the school of politics; apparently Reunion is a reason to keep France on the UK’s banned list. Meanwhile the Delta variant rampages through the United States where access for UK & European passport holders remains impossible unless you travel via Latin America or the Caribbean first. It’s a mad world!
With some 81.2 million seats this week we are half of one percent down on last week or 391,000 fewer seats, as we have said before, until some major international markets re-open then this is as good as it gets. The airlines frustrations are reflected by a further 24 million seats being removed for sale to the end of October and there remains many flights for sale that are very unlikely to operate soon. Many airlines and airports are now expecting 2021 numbers to be lower than 2020, a scenario that most people would have dismissed as impossible at the beginning of the year; well, the impossible can happen.
Chart 1 – Scheduled Airline Capacity by Month
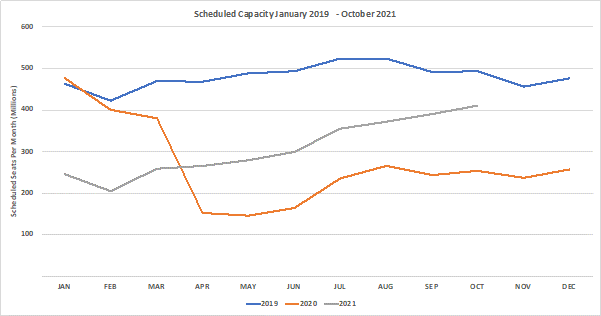
Source: OAG
With many of the major data points unchanged week on week we’ve flipped this week’s data to show some other points and highlight some of the challenges that get lost in the bigger pieces of data. Starting at the regional level we have identified those regions with the largest capacity reductions compared to the same week in August 2019 and three markets remain at less than 50% of their pre-covid levels. Southeast Asia has throughout the pandemic struggled to recover and large markets such as Indonesia, Singapore, Malaysia and the Philippines remain in near lockdowns although Singapore is once again attempting to slowly restart services but with its near neighbours seeing high infection rates those bubbles may well burst again.
The Southwest Pacific is essentially Australia and the announcement of no real change in lockdowns and international access before 70% of the population have been vaccinated suggest that it will be the second quarter of 2022 before any substantive changes happen. By then Australia will have been in two years of lockdown, for many trapped that may feel like a prison sentence for the English cricket team it may just be the excuse they’ve been looking for not to contest the Ashes this winter.
The closest regional market to a full recovery may surprise many, Central America is only 12% below the August 2019 levels with Central/Western Africa at 14% below the same point last year. Many countries in the region continue to allow relatively free movement across international borders and the growth in “vaccine travel” to the United States has certainly maintained levels of capacity.
Table 1– Scheduled Airline Capacity by Region
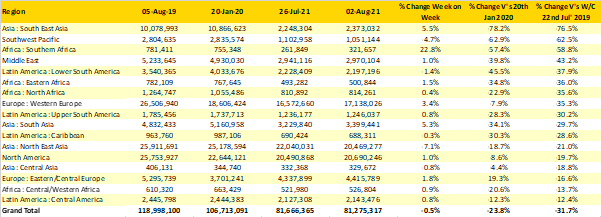
Source: OAG
Yes, the United States is the largest market in the world but with no change week on week, Chinese capacity is down by 10% week on week as the seasonal holidays begin to wind down and Canada is bouncing back with 19% week on week growth. But the top twenty country markets are broadly unchanged with just a bit of jostling at the back; rather like in an 800 metre men’s final.
So, rather like a journalist looking for the sensational angle rather than the real story we’ve had a look at those country markets where capacity has all but disappeared. Applying a minimum criterion of at least 250,000 seats a week in August 2019 we have listed below the worst performing recoveries; this is not a table anyone should want to be in! Sadly, Malaysia continues to run with less than 10% of normal capacity and for a country split in two by a massive stretch of water that is a problem and for the two local airlines a continued cause for concern. Indeed, Tony Fernandes former investment in QPR now looks better than the situation facing Air Asia Malaysia.
Chinese Taipei is in only a slightly better situation in Malaysia and with its major markets of Hong Kong and China firmly locked with the keys thrown away a recovery looks a long way from picking up anytime soon. Nine country markets remain at less than 30% of their normal capacity levels with the wide geographic spread highlighting the global challenges yet to be faced.
Table 2- Scheduled Capacity, Top 20 Country Markets
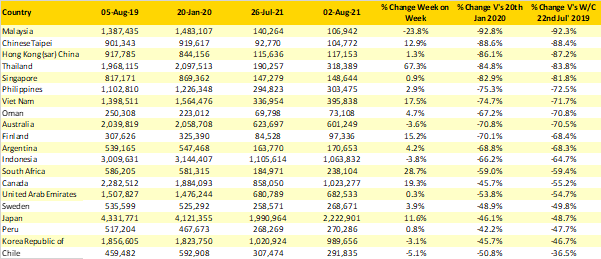
Source: OAG
Given the table above it would be no surprise that airlines such as Cathay Pacific, Singapore Airlines and Air Canada are all struggling to operate anything near their full schedule although in the last week things are beginning to improve for Air Canada. Therefore, in the table below we have highlighted those airlines that have added the most capacity since the first week of April when the IATA Summer Season started.
Proving both the resilience and the remarkable flexibility of airlines there are some standout carriers that have rebuilt their networks in the last few months. Not surprisingly Ryanair lead the way with some 2.5 million seats placed back in the market; twice as many as their closest rival in the table American Airlines who are benefitting from the strength of the US domestic market.
Perhaps slightly surprisingly Lufthansa rank fifth in this table, a legacy carrier with a heavy reliance on connecting traffic over half a million seats have been added back. It will be interesting to see what their latest quarterly results will look like, similarly for the Air France/KLM group with some 700,000 seats added. All three carriers may be enjoying the benefit of Europe opening ahead of the United Kingdom since British Airways have just managed to put an additional 206,000 seats a week back into the skies.
Table 3 - Top 20 Airlines Capacity Growth Since 29th March 2021
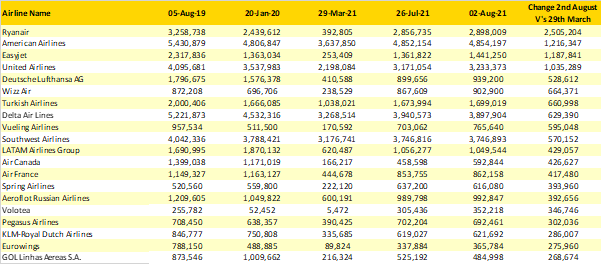
Source: OAG
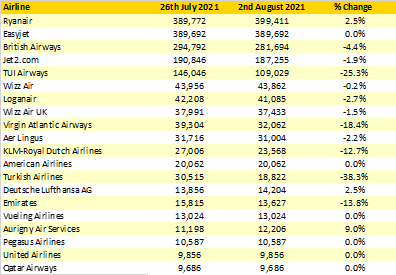
Finally, in this week’s data we have looked at the immediate impact of the UK Governments relaxation of entry requirements announced last Wednesday for visitors from the European Union (except France) and the United States. The table below shows the capacity on offer for the last week of August compared to the capacity that they had on offer in last week’s schedules filing. Across the largest twenty carriers there are mixed messages, Ryanair have added an extra 10,000 seats whilst British Airways who are committed to “growing cautiously” have shrunk capacity by some 4% and Virgin Atlantic continue to cut capacity, this week by 18% as the US remains out of bounds.
Table 4 - Week on Week Capacity Changes ex the UK, 26th July V’s 2nd August 2021
In truth this week’s data is pretty similar to last weeks and it’s very likely that next week’s data will be similar, the market is no longer becalmed but in suspended animation waiting for a breakthrough moment. Forecasting where that breakthrough will come from is not too difficult, it certainly won’t be China, the UK tried and failed so that probably leaves the United States, so Joe, if you are reading this week’s blog, it’s all down to you now!
Stay safe everyone.