

- The Top 10 US airlines remains unchanged from last month.
- American Airlines remains the largest carrier in the US by seat volume in May 24, with 2.4m more seats than Southwest who remain in second place.
- The big 4 continue to dominate the market with almost three quarters of the share of capacity.


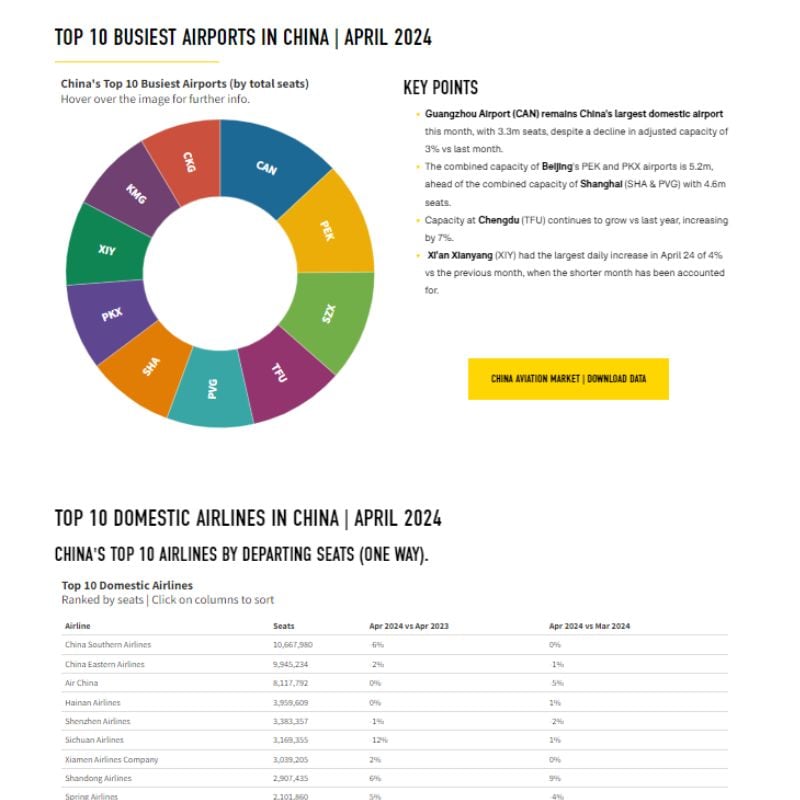
China Aviation Market Data
This month's leading airlines, airports, cities and more from the Chinese market.
View Data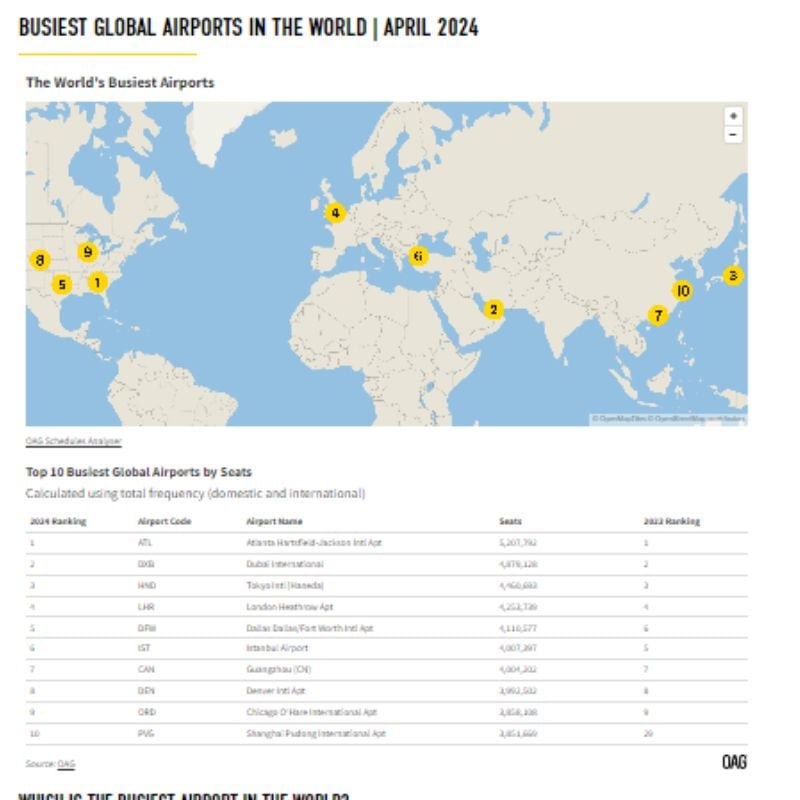
Busiest Airports
Data and analysis on the busiest global, international and regional airports, updated monthly.
View Data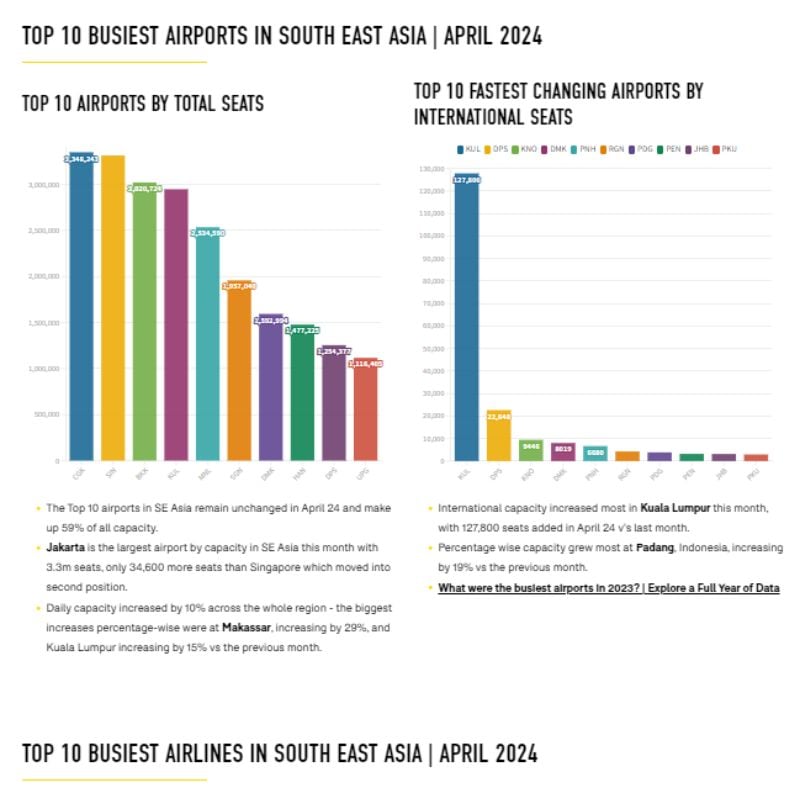
South East Asian Aviation Market Data
SE Asia's biggest country markets, airports, airlines and more are updated each month.
View Data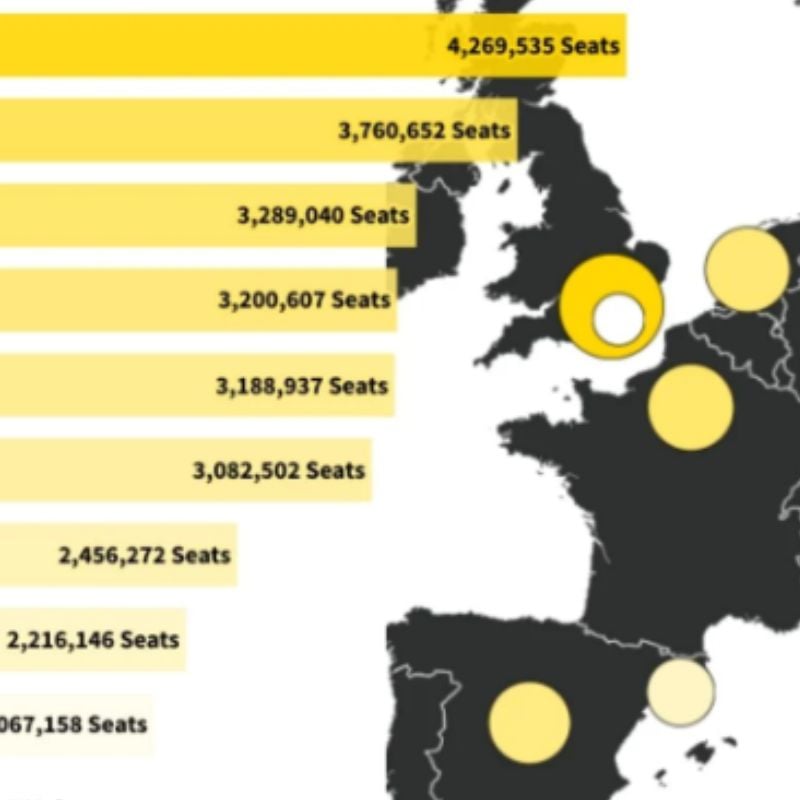

Aviation Market Analysis
Analysis of the latest data and developments in the aviation world.
Read NowShare: