Southeast Asia aviation market briefing
Latest Southeast Asia flight data insights and analysis
August 2026
Enter your email for instant access to the data
How much airline capacity does Southeast Asia have in 2026?
Monthly scheduled capacity: August 2025 vs August 2026
SE Asia capacity to the rest of Asia Pacific remains the largest international market with 16.8m seats, reducing by 0.2% (35,900 fewer seats) vs last year.
International capacity within SE Asia, the next largest market with 6.7m seats, increased by 1.2% (82,900 additional seats) vs Aug 25.
Capacity to Europe and North America grew at the fastest rate increasing by 10.8% and 9% respectively, with 1.7m seats and 325,400 seats.
Capacity to the Middle East declined by 4.6% vs Aug 25 (124,100 fewer seats).
How are low cost carriers performing in Southeast Asia?
Mainline carriers now hold 56% of Southeast Asian capacity with 28.5m seats, growing by 5.9% vs August 2025. Low cost carriers contracted by 4.9% to 22.5m seats, reducing their share from 47% to 44% year on year.
LCC contraction continues across the region, led by Thai AirAsia at −23.4% and AirAsia at −17.0%, partially offset by Citilink's exceptional +72.8% growth, while mainline growth is led by Vietnam Airlines and Batik Air.
Mainline vs low-cost
Which Southeast Asian country has the most airline seats?
Indonesia remains the largest SE Asia market with 11m seats, an increase of 4.3% vs August 25.
Viet Nam is the second largest market in SE Asia with 7.3m seats, a 10% increase vs last year.
Capacity reduced in Malaysia, the Philippines and Thailand with 376,400, 286,500 and 123,400 fewer seats respectively.
Top 10 countries by seat capacity
Capacity reduced in Malaysia, Thailand and the Philippines with 476,500, 212,600 and 205,900 fewer seats respectively. As highlighted in June's Blog regarding mid season capacity changes, this appears to be the impact of the Middle East crisis on the cost of fuel and the cost of living in the region.
Which Southeast Asian country has the most domestic flights?
Indonesia is the largest domestic market in SE Asia, with 8.8m seats, an increase of 5.4% in capacity (450,500 additional seats).
Domestic capacity increased at the fastest rate in Viet Nam by 13.8% vs August 25, 575,400 additional seats compared to Aug 25.
Volume wise domestic capacity in Malaysia declined most, by 456,800 seats in August 26.
Top domestic markets by seat capacity
Which is the biggest airline in Southeast Asia?
Vietnam Airlines is the busiest airline with 2.8m seats and increased capacity by 8.2% vs last year.
Seat capacity by airline
Top 10 airlines by seats · August 2026 · Search-readable table
| No | IATA | Airline | Seats (Aug 2026) | YoY |
|---|---|---|---|---|
| 1. | VN | Vietnam Airlines | 2.80m | +8.2% |
| 2. | AK | AirAsia | 2.48m | −17.0% |
| 3. | JT | Lion Air | 2.33m | −11.1% |
| 4. | VJ | Vietjet | 2.24m | −5.7% |
| 5. | 5J | Cebu Pacific Air | 2.15m | +3.8% |
| 6. | SQ | Singapore Airlines | 1.84m | +2.4% |
| 7. | ID | Batik Air | 1.45m | +8.0% |
| 8. | FD | Thai AirAsia | 1.44m | −23.4% |
| 9. | QG | Citilink | 1.43m | +72.8% |
| 10. | PR | Philippine Airlines | 1.34m | −11.5% |
Thai AirAsia reduced capacity at the fastest rate this month by 23.4%, followed by AirAsia by 17%, 440,300 and 509,400 fewer seats respectively.
Citilink increased capacity at the fastest rate of 72.8% vs last year (601,000 additional seats) to 1.4m seats.
The region has scheduled traffic operated by 176 airlines at 300 airports.
What is the busiest airport in Southeast Asia?
Singapore Changi remains the largest airport in the region, with 3.6m seats. This represents a 3.5% increase in capacity compared to last year. Jakarta, Indonesia, is second busiest airport, with capacity of 3.3m an increase of 3.1% vs August 25.
Capacity at Bangkok Don Mueang, Manila and Kuala Lumpur continued to reduce by 7.5%, 5.8% and 3.4%, with 122,900, 156,700 and 113,600 fewer seats respectively.
Capacity increased at the fastest rate of 12.2% vs last year, 230,100 additional seats, in Hanoi, Vietnam.
| No | Code | Airport | Seats | YoY |
|---|---|---|---|---|
| 1. | SIN | Singapore Changi | 3.64m | +3.5% |
| 2. | CGK | Jakarta | 3.32m | +3.1% |
| 3. | BKK | Bangkok Suvarnabhumi | 3.22m | +1.0% |
| 4. | KUL | Kuala Lumpur | 3.22m | −3.4% |
| 5. | MNL | Manila | 2.56m | −5.8% |
| 6. | SGN | Ho Chi Minh City | 2.39m | +3.2% |
| 7. | HAN | Hanoi | 2.12m | +12.2% |
| 8. | DMK | Bangkok Don Mueang | 1.52m | −7.5% |
| 9. | DPS | Denpasar-Bali | 1.30m | −2.4% |
| 10. | UPG | Makassar | 0.97m | −1.0% |
Source: OAG · hover chart or click a table row to cross-highlight
Where do Southeast Asian airlines fly internationally?
SE Asia capacity to the rest of Asia Pacific remains the largest international market with 16.8m seats, reducing by 0.2% (35,900 fewer seats) vs last year.
International capacity within SE Asia, the next largest market with 6.7m seats, increased by 1.2% (82,900 additional seats) vs Aug 25.
Capacity to Europe and North America grew at the fastest rate increasing by 10.8% and 9% respectively, with 1.7m seats and 325,400 seats.
Capacity to the Middle East declined by 4.6% vs Aug 25 (124,100 fewer seats).
Capacity by destination region
Southeast Asia aviation: frequently asked questions
Get the data
Add your email and we'll send you all of this month's data to download.
More resources from OAG
Airline Capacity By Region | march 2026
Where do International Flights From SOUTHEAST Asia Go?
- Capacity to the rest of Asia Pacific remains the largest international market with 18.5m seats, an increase of 9.9% (1.7m more seats) vs last year.
- International capacity within SE Asia, the next largest market with 7.2m seats, grew by 6.9% (460k more seats) vs Mar 2025.
- Capacity to North America continues at the fastest rate this month, increasing by 13.8%.

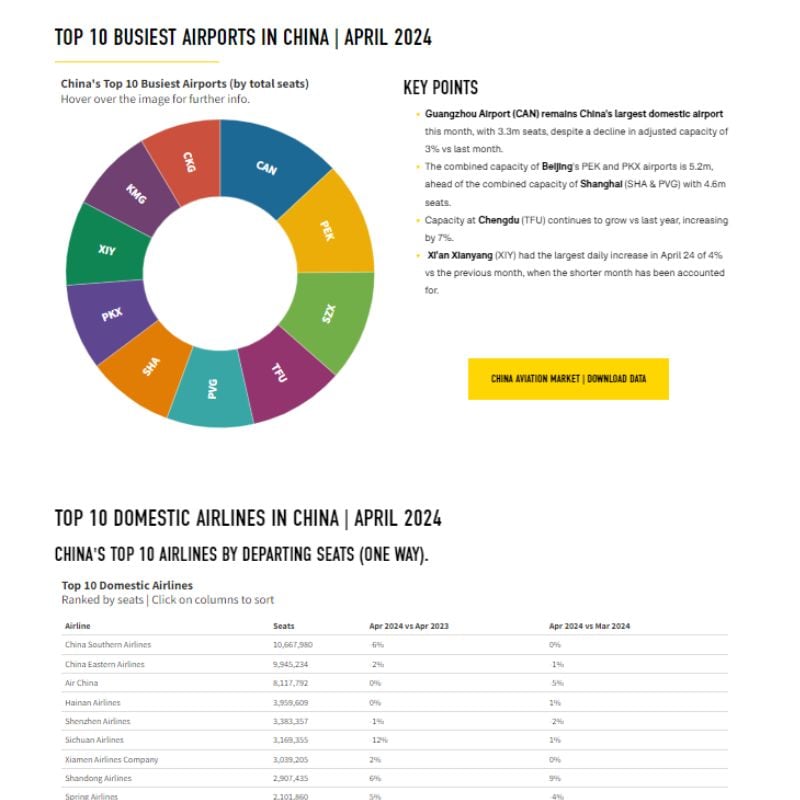
China Aviation market Data
The busiest airports, largest airlines, biggest cities for airline capacity and more
View Data
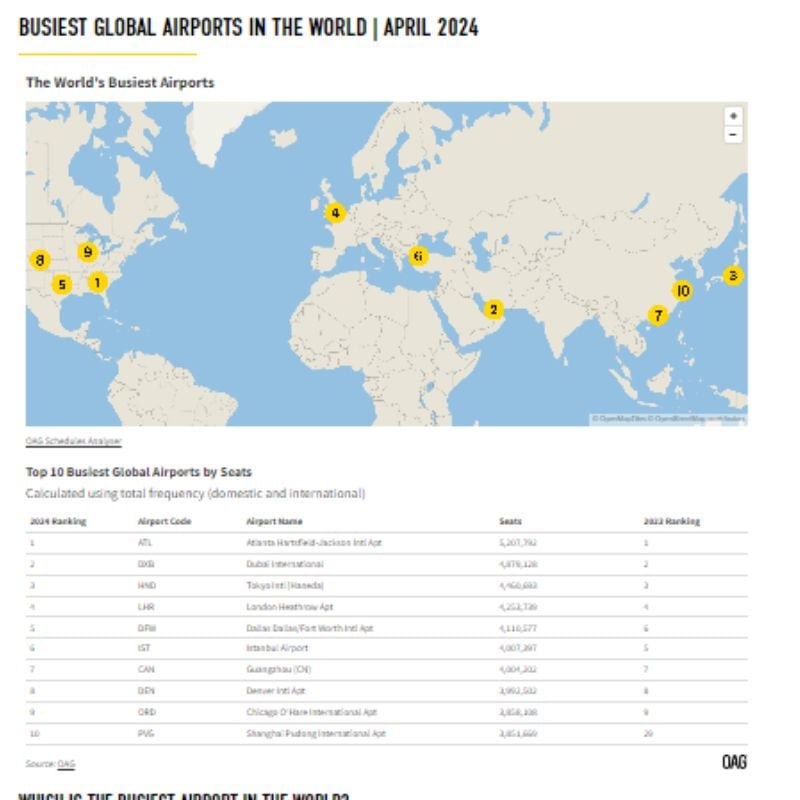
Busiest Airports
Data and analysis on the busiest global, international and regional airports, updated monthly.
View Data
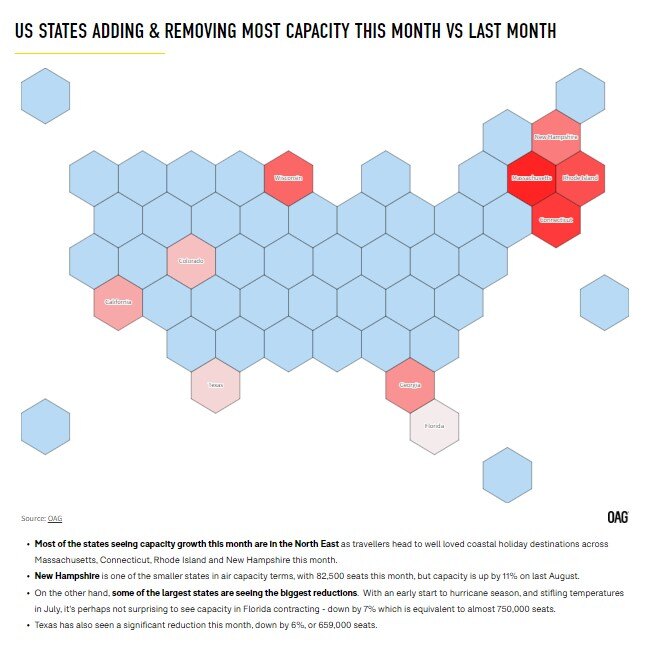
US Aviation Market Data
This month's leading airlines, airports, states and more from the US market.
View Data

Aviation Market Analysis
Analysis of the latest data and developments in the aviation world.
Read Now
Overall capacity in the SE Asia market remained constant this month with a 0.8% increase compared to Aug 25 to 51million seats.
Domestic capacity increased by 1.4% this month and represents 45% of the market.
International capacity was almost static, with just an 0.4% increase to 28.2m and represents 55% market share.