
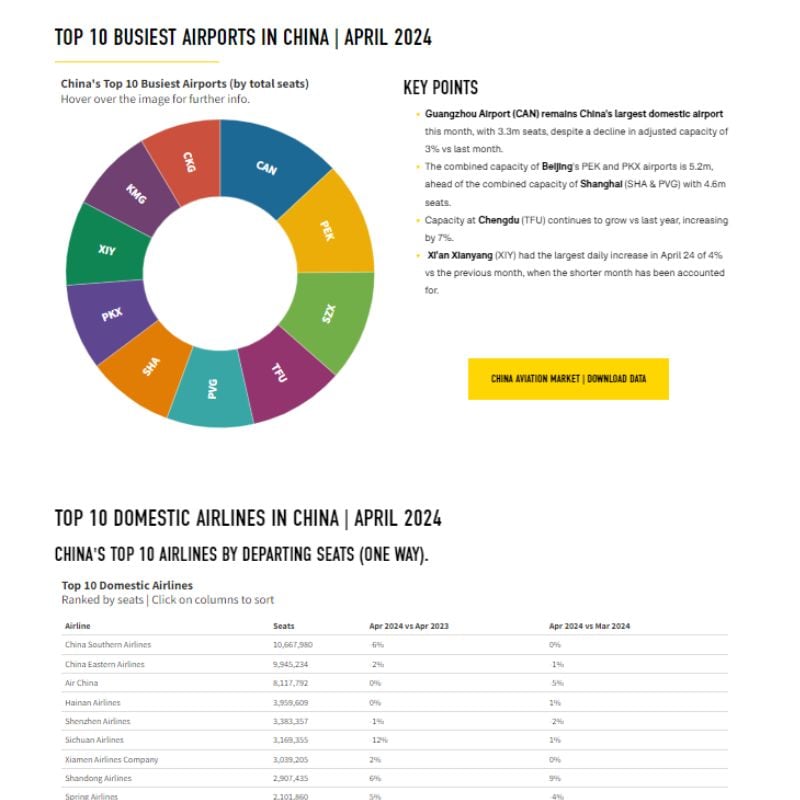
China Aviation market Data
The busiest airports, largest airlines, biggest cities for airline capacity and more
View Data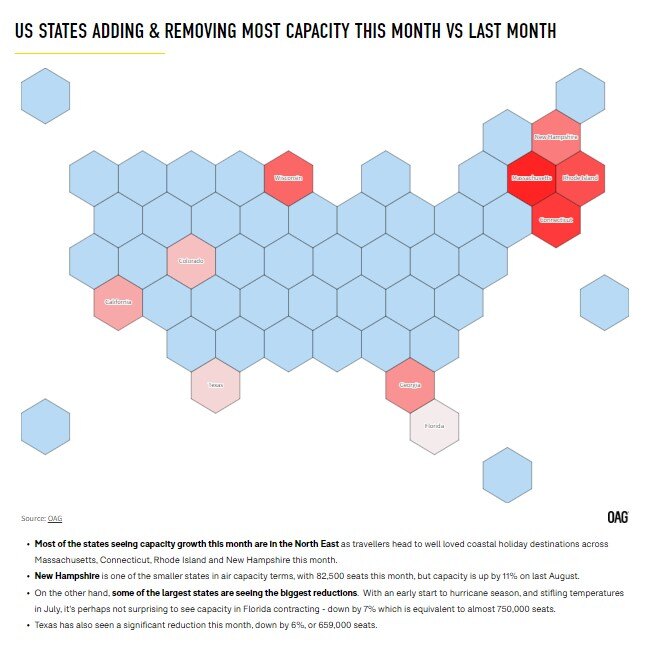
US Aviation Market Data
This month's leading airlines, airports, states and more from the US market.
View Data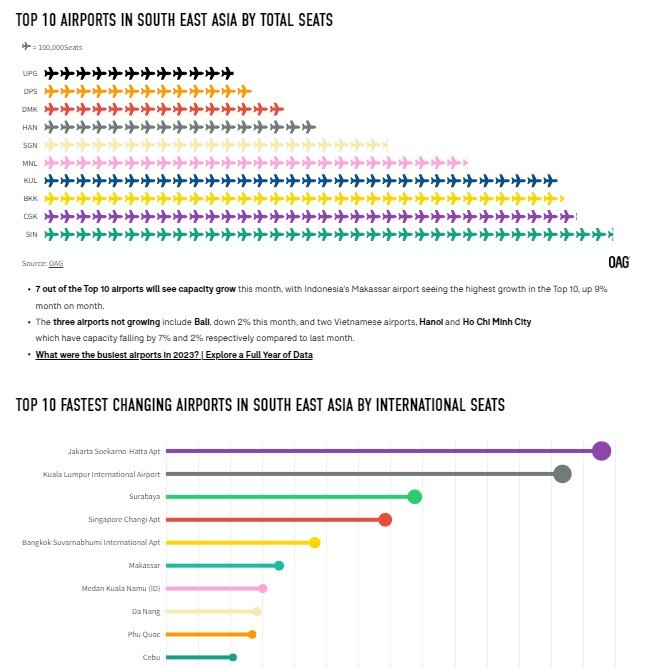
South East Asian Aviation Market Data
SE Asia's biggest country markets, airports, airlines and more are updated each month.
View Data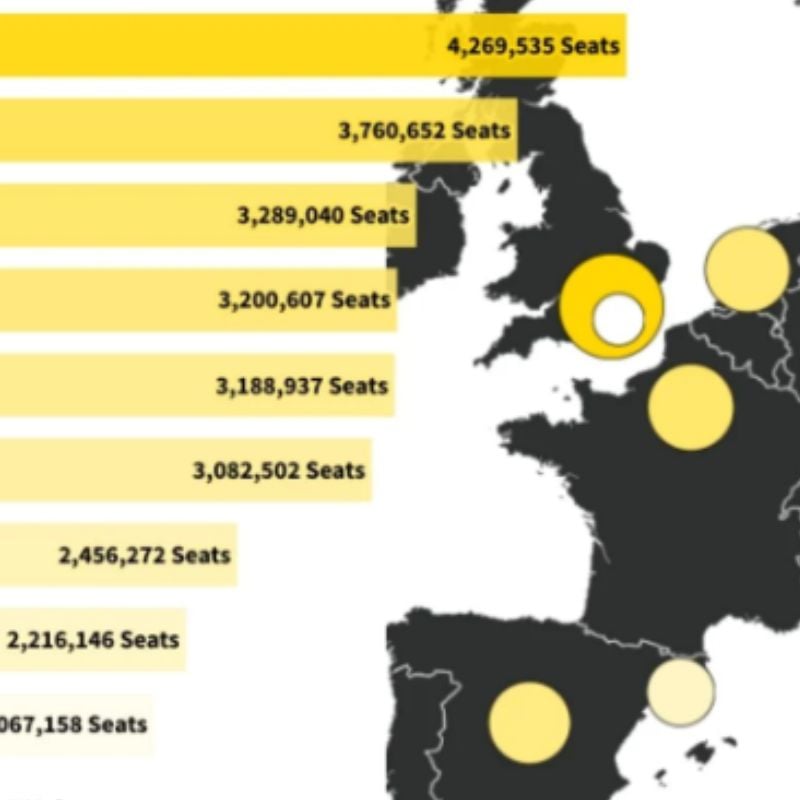

Aviation Market Analysis
Analysis of the latest data and developments in the aviation world.
Read Now