

Some US domestic fares have fallen nearly 30% year-on-year. Others are up by double digits. OAG data shows exactly which routes are moving in each direction, and why.


Tap centre to pause · tap left or right to skip
The slides above tell the headline story, but behind each percentage move is a specific combination of carrier decisions, capacity changes, and demand signals. OAG's Q2 2026 analysis of the top US domestic and international routes breaks down exactly what is driving US airfare trends this year, route by route.
View the full Q2 2026 dataset ➜
The biggest year-on-year domestic airfare price drops in Q2 2026
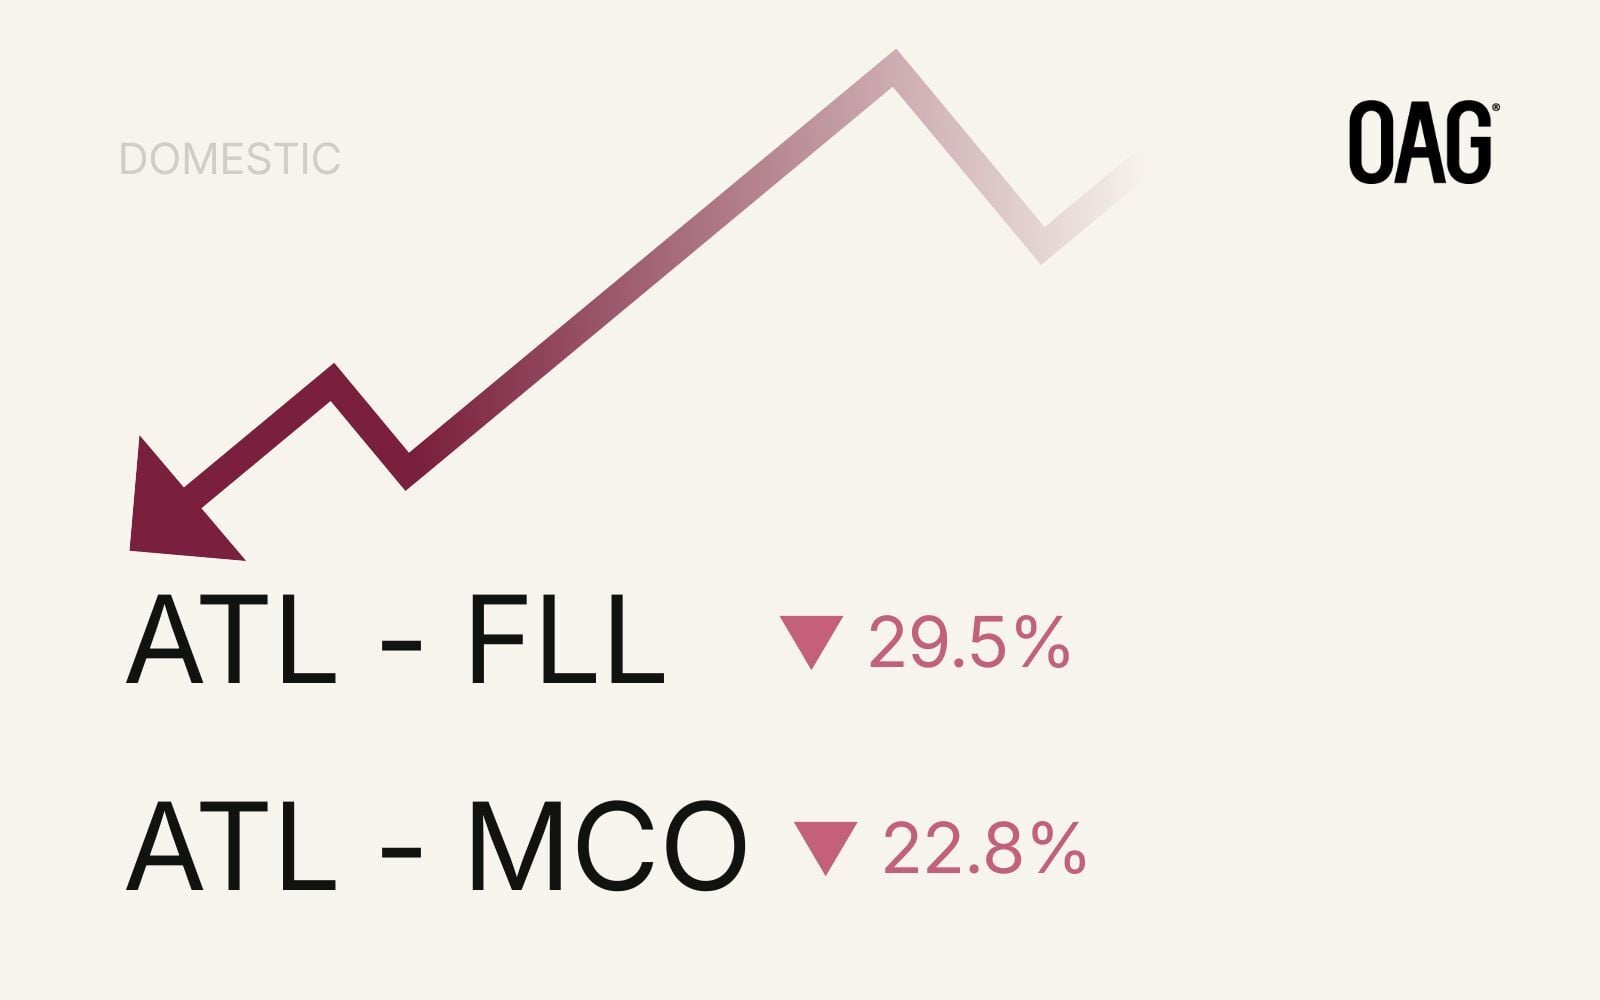
Across the top 10 US domestic routes, fares have fallen on 4 of them year-on-year. The declines are concentrated on leisure routes into Florida and on the competitive transcontinental corridor. In most cases, a carrier exit followed by aggressive LCC re-entry is a significant part of the story.
- ATL - FLL: ▼ 29.5%
- ATL - MCO: ▼ 22.8%
- JFK - LAX: ▼ 20.9%
- LAS - ORD: ▼ 0.5%
The most dramatic domestic fare moves in Q2 2026 are on routes where Spirit Airlines' exit has been followed by aggressive capacity additions from Frontier and JetBlue. ATL-FLL outbound fares are down approximately 29.5% year-on-year against a 10% capacity increase, the classic dynamic of new entrants competing on price to establish market share. ATL-MCO follows a near-identical pattern at a 22.8% decline. Whether these fare levels are sustainable at current load factors remains an open question for the second half of 2026.
The JFK-LAX transcontinental corridor is showing similar fare softness but the driver is less clear-cut. The continued decline may reflect underlying demand weakness rather than a supply-side correction alone. Of all the domestic routes showing fare declines, this is the one most worth watching as US airfare trends develop into Q3.
Which US domestic routes are seeing airfare increases in 2026?
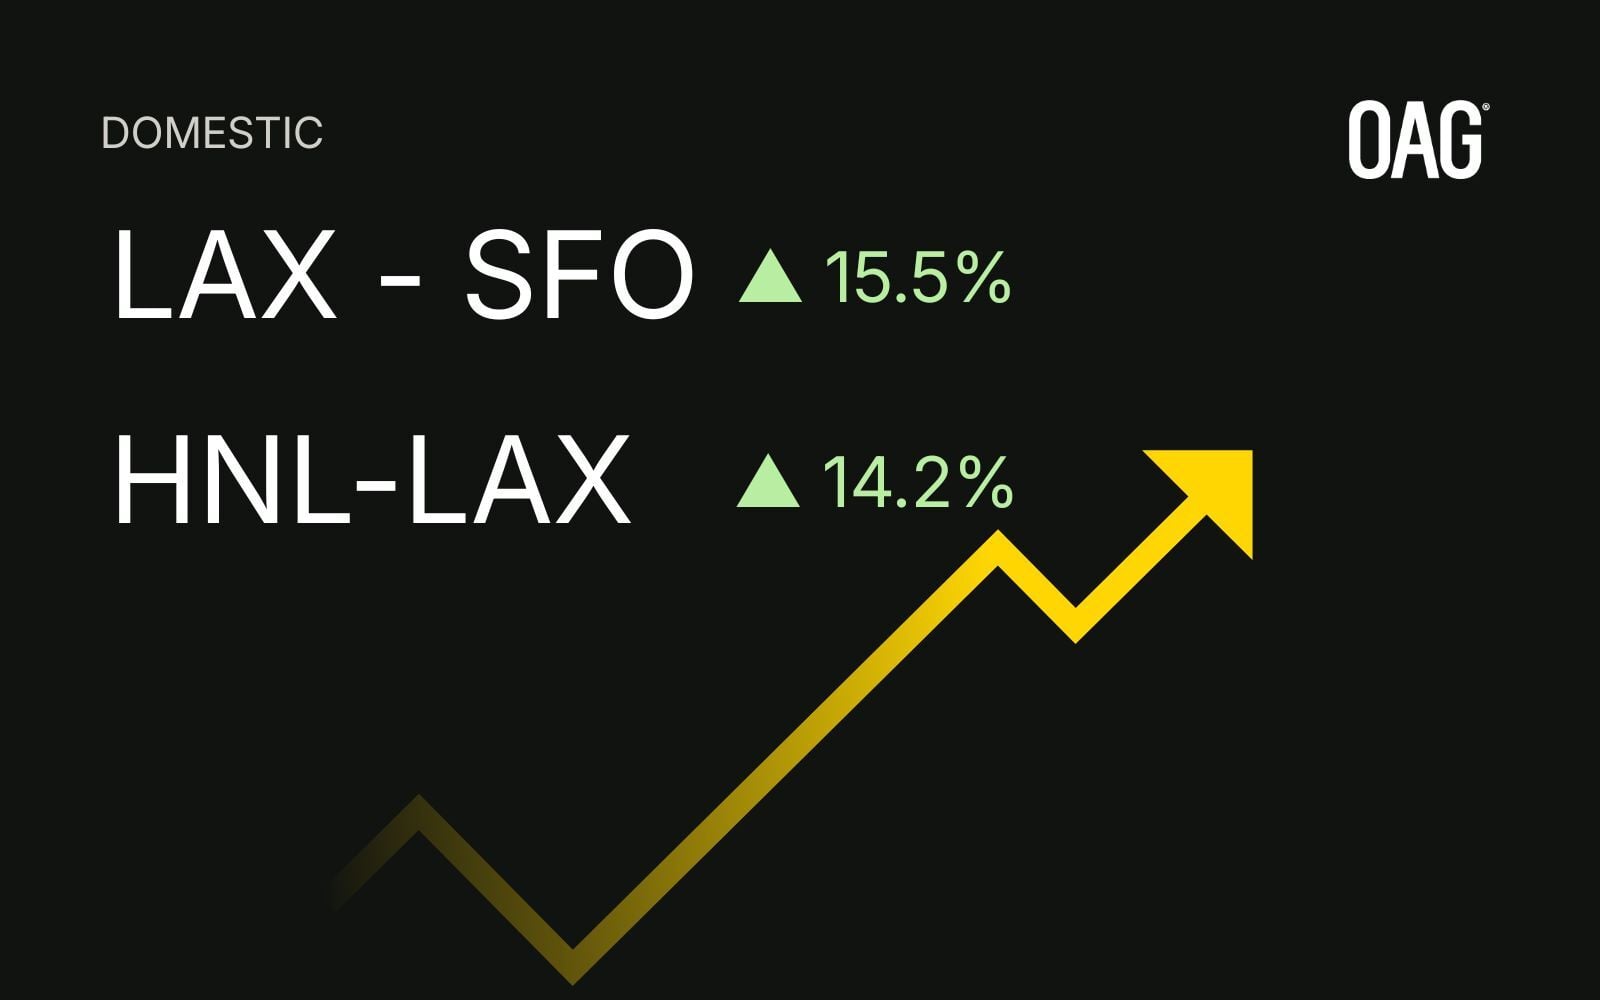
Hawaii and the West Coast are bucking the trend in Q2 2026, with sustained leisure demand and disciplined capacity supporting higher prices.
Notable changes include:
-
LAX-SFO: ▲ 15.5%
-
HNL - LAX: ▲14.2%
-
HNL - OGG: ▲ 8.5%
US international airfare trends in Q2 2026
Internationally, the Q2 2026 picture splits sharply between outbound and inbound. Carriers flying passengers from the US to Europe are seeing stronger fares; carriers bringing passengers into the US from key origin markets are seeing the opposite.
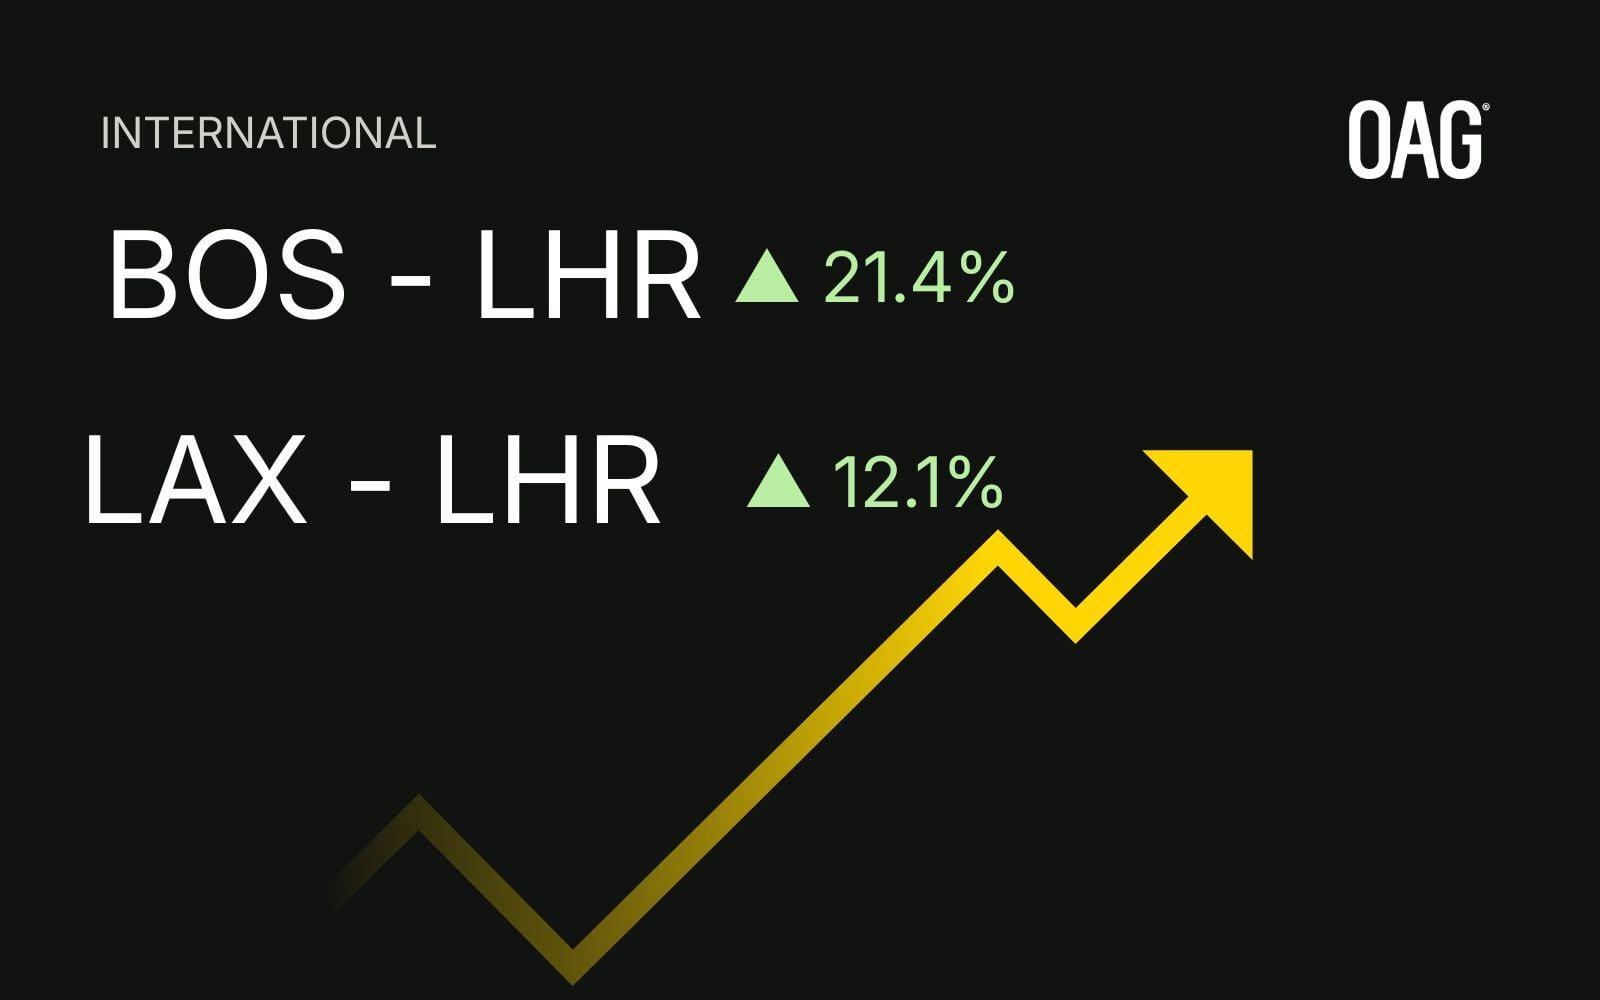
Fares are rising on outbound transatlantic routes, helped by robust summer demand and a World Cup travel boost.
-
BOS - LHR: ▲ 21.4%
-
LAX - LHR: ▲12.1%
-
JFK - LHR: ▲ 9.%
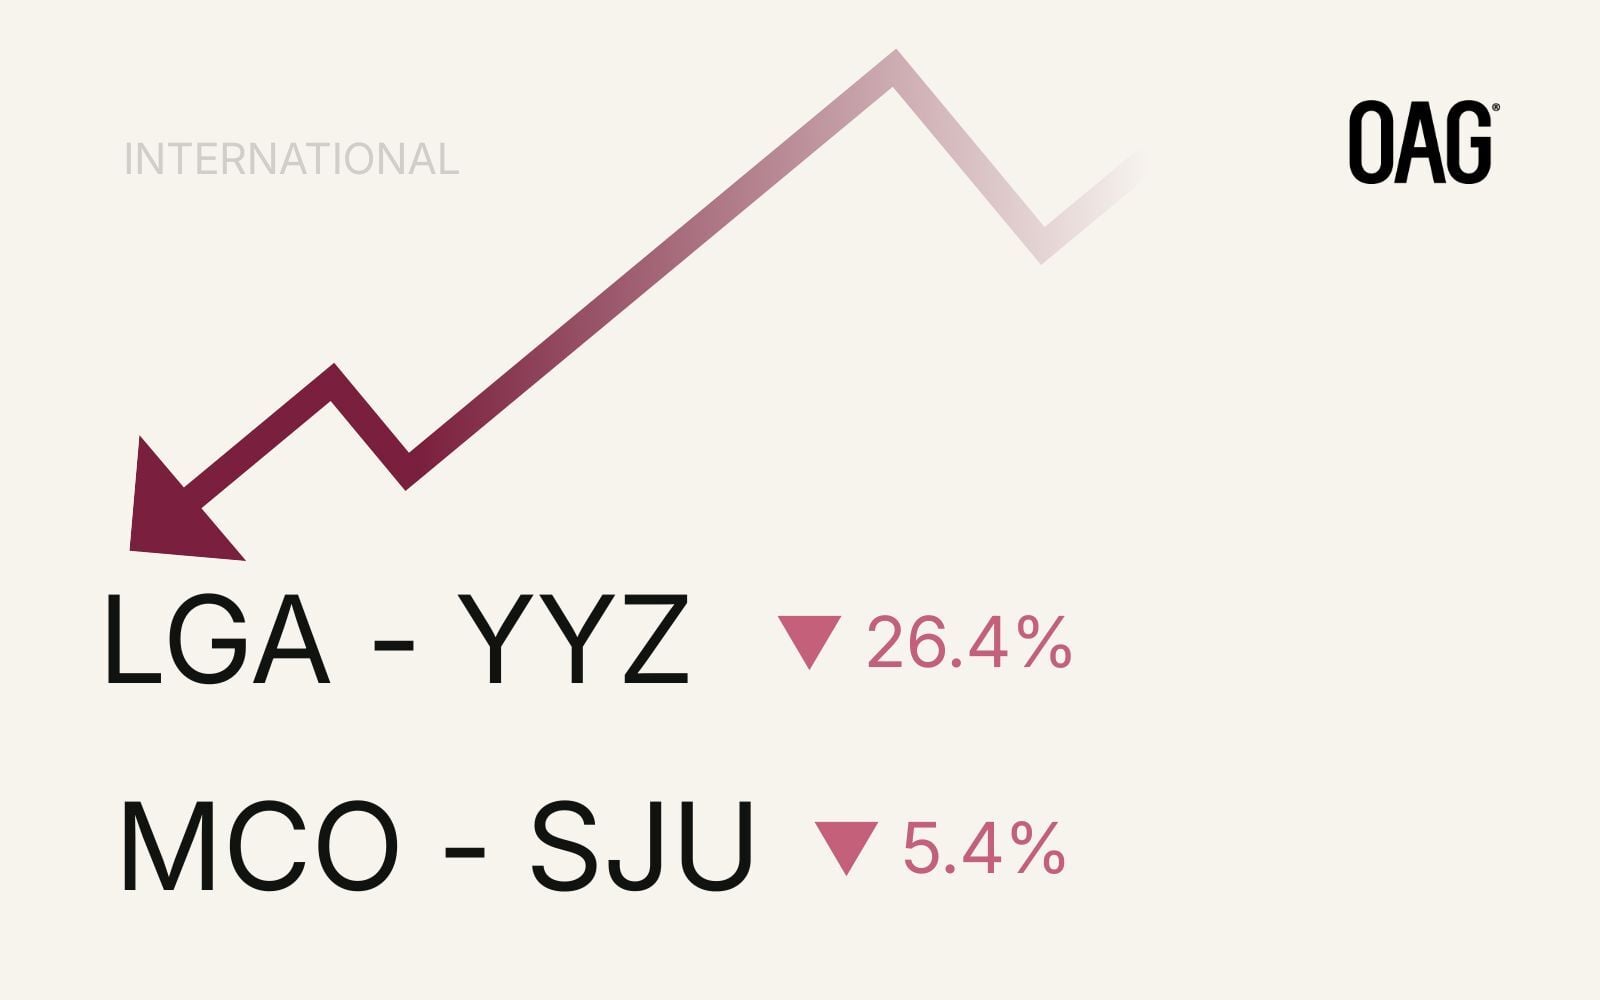
Inbound fares tell a different story. LAX-LHR inbound is down 6%, ICN-LAX inbound is down approximately 14%, and LGA-YYZ inbound is down approximately 20%. The divergence between outbound strength and inbound weakness on international routes is one of the more complex yield management challenges facing US carriers heading into the second half of 2026.
OAG's Airfare Analytics provides route-level fare data and trend analysis across domestic and international markets. View the full Q2 2026 dataset here.