

On-time performance flight data
Discover the world's most punctual global airlines
Explore September's OTP results
Every month, we track and present which airlines have achieved the best on-time performance.
Use the tabs below to explore the top:
-
Major airlines (more than 20,000 flights)
-
Large airlines (between 10,000 and 20,000 flights)
- Low-cost airlines
-
All airlines (more than 1,500 flights)
Never miss an update
Add your email, and we will drop you an email each time fresh OTP data is released.

No airlines match your search.
| # | Airline | Region | OTP | Cancellations | Flights |
|---|---|---|---|---|---|
| 1 | Hainan Airlines | Asia : North East Asia | 92.60% | 0.99% | 20,537 |
| 2 | China Southern Airlines | Asia : North East Asia | 91.61% | 0.13% | 67,141 |
| 3 | Avianca | Latin America : Upper South America | 87.27% | 1.10% | 21,649 |
| 4 | IndiGo | Asia : South Asia | 86.59% | 0.37% | 58,305 |
| 5 | Qantas Airways | Southwest Pacific | 86.57% | 0.85% | 23,460 |
| 6 | Shenzhen Airlines | Asia : North East Asia | 86.11% | 0.61% | 21,559 |
| 7 | SAS Scandinavian Airlines | Europe : Western Europe | 85.12% | 1.09% | 24,172 |
| 8 | China Eastern Airlines | Asia : North East Asia | 84.31% | 2.22% | 70,486 |
| 9 | Air France | Europe : Western Europe | 81.81% | 1.06% | 23,039 |
| 10 | LATAM Airlines Group | Latin America : Lower South America | 81.53% | 0.87% | 51,207 |
| 11 | Delta Air Lines | North America | 81.46% | 0.92% | 149,522 |
| 12 | Deutsche Lufthansa Ag | Europe : Western Europe | 80.12% | 0.47% | 31,715 |
| 13 | Alaska Airlines | North America | 79.76% | 1.60% | 45,948 |
| 14 | Azul Airlines | Latin America : Lower South America | 79.07% | 3.94% | 24,171 |
| 15 | Japan Airlines | Asia : North East Asia | 77.68% | 1.46% | 25,600 |
| 16 | United Airlines | North America | 77.63% | 1.00% | 149,944 |
| 17 | All Nippon Airways | Asia : North East Asia | 77.50% | 1.74% | 25,240 |
| 18 | American Airlines | North America | 75.97% | 1.07% | 185,470 |
| 19 | JetBlue Airways | North America | 74.76% | 1.82% | 24,229 |
| 20 | British Airways | Europe : Western Europe | 74.34% | 3.28% | 26,499 |
| 21 | Southwest Airlines | North America | 74.01% | 0.35% | 112,186 |
| 22 | KLM Royal Dutch Airlines | Europe : Western Europe | 72.91% | 2.65% | 22,521 |
| 23 | Ryanair | Europe : Western Europe | 72.88% | 0.94% | 108,329 |
| 24 | Air Canada | North America | 71.24% | 3.46% | 33,625 |
| 25 | easyJet | Europe : Western Europe | 69.62% | 1.87% | 56,501 |
Major airlines = more than 20,000 flights in Sep 2026 · Source: OAG Flight Status Data
No airlines match your search.
| # | Airline | Region | OTP | Cancellations | Flights |
|---|---|---|---|---|---|
| 1 | Chengdu Airlines | Asia : North East Asia | 93.70% | 0.24% | 10,046 |
| 2 | Shandong Airlines | Asia : North East Asia | 92.97% | 0.04% | 16,023 |
| 3 | Wideroe'S Flyveselskap | Europe : Western Europe | 92.80% | 2.16% | 11,242 |
| 4 | Copa Airlines | Latin America : Central America | 90.72% | 0.11% | 12,490 |
| 5 | Volaris | Latin America : Central America | 90.00% | 0.09% | 14,325 |
| 6 | Aeromexico | Latin America : Central America | 89.36% | 0.49% | 13,586 |
| 7 | Juneyao Airlines | Asia : North East Asia | 87.67% | 0.09% | 10,615 |
| 8 | Air New Zealand | Southwest Pacific | 87.14% | 1.57% | 13,228 |
| 9 | Austrian Airlines Ag Dba Austrian | Europe : Western Europe | 86.81% | 0.56% | 11,821 |
| 10 | Korean Air | Asia : North East Asia | 86.80% | 0.22% | 10,998 |
| 11 | Iberia | Europe : Western Europe | 86.25% | 0.69% | 19,528 |
| 12 | Xiamen Airlines | Asia : North East Asia | 85.44% | 0.83% | 18,605 |
| 13 | Cathay Pacific Airways | Asia : North East Asia | 85.22% | 0.48% | 10,412 |
| 14 | Spring Airlines | Asia : North East Asia | 85.13% | 0.25% | 17,750 |
| 15 | WestJet | North America | 85.08% | 0.81% | 17,390 |
| 16 | SunExpress | Europe : Eastern/Central Europe | 84.79% | 0.10% | 11,521 |
| 17 | Lot - Polish Airlines | Europe : Eastern/Central Europe | 84.09% | 0.21% | 10,462 |
| 18 | Wizz Air | Europe : Eastern/Central Europe | 83.81% | 0.07% | 17,383 |
| 19 | China Express Airlines | Asia : North East Asia | 83.63% | 0.58% | 12,900 |
| 20 | Vivaaerobus | Latin America : Central America | 83.22% | 1.07% | 12,528 |
| 21 | Aer Lingus | Europe : Western Europe | 82.88% | 0.99% | 10,945 |
| 22 | Finnair | Europe : Western Europe | 82.78% | 0.86% | 10,532 |
| 23 | Airasia | Asia : South East Asia | 82.34% | 1.01% | 13,977 |
| 24 | Qatar Airways | Middle East | 80.50% | 0.27% | 15,224 |
| 25 | Air India | Asia : South Asia | 80.18% | 0.41% | 17,778 |
| 26 | Air India Express | Asia : South Asia | 78.42% | 0.02% | 13,688 |
| 27 | Wizz Air Malta | Europe : Western Europe | 77.28% | 0.70% | 16,614 |
| 28 | Vietnam Airlines | Asia : South East Asia | 76.43% | 1.05% | 12,533 |
| 29 | Saudi Arabian Airlines | Middle East | 75.50% | 3.85% | 15,131 |
| 30 | Virgin Australia International | Southwest Pacific | 75.26% | 1.43% | 14,087 |
| 31 | Frontier Airlines | North America | 75.18% | 0.65% | 18,283 |
| 32 | Emirates | Middle East | 75.00% | 0.15% | 14,542 |
| 33 | Jetstar Airways | Southwest Pacific | 74.85% | 0.74% | 11,718 |
| 34 | Swiss | Europe : Western Europe | 74.53% | 0.89% | 12,891 |
| 35 | Eurowings | Europe : Western Europe | 70.47% | 0.66% | 17,985 |
| 36 | TAP Air Portugal | Europe : Western Europe | 66.86% | 0.10% | 10,305 |
| 37 | Jet2.Com | Europe : Western Europe | 66.06% | 0.01% | 15,292 |
| 38 | Aegean Airlines | Europe : Western Europe | 64.92% | 0.10% | 11,215 |
| 39 | Ethiopian Airlines | Africa : Eastern Africa | 62.23% | 0.04% | 14,823 |
| 40 | ITA Airways | Europe : Western Europe | 61.64% | 1.27% | 10,756 |
Large airlines = between 10,000 and 20,000 flights in Sep 2026 · Source: OAG Flight Status Data
No airlines match your search.
| # | Airline | Region | OTP | Cancellations | Flights |
|---|---|---|---|---|---|
| 1 | Changan Airlines | Asia : North East Asia | 96.03% | 0.00% | 1,903 |
| 2 | Royal Jordanian | Middle East | 94.23% | 0.10% | 4,092 |
| 3 | Chengdu Airlines | Asia : North East Asia | 93.70% | 0.24% | 10,046 |
| 4 | Guangxi Beibu Gulf Airlines | Asia : North East Asia | 93.25% | 0.07% | 2,966 |
| 5 | Qingdao Airline | Asia : North East Asia | 93.12% | 0.48% | 3,777 |
| 6 | Shandong Airlines | Asia : North East Asia | 92.97% | 0.04% | 16,023 |
| 7 | Air Busan | Asia : North East Asia | 92.81% | 0.03% | 3,521 |
| 8 | Wideroe'S Flyveselskap | Europe : Western Europe | 92.80% | 2.16% | 11,242 |
| 9 | Hainan Airlines | Asia : North East Asia | 92.60% | 0.99% | 20,537 |
| 10 | Hebei Airlines | Asia : North East Asia | 92.28% | 0.28% | 3,951 |
| 11 | Zhejiang Loong Airlines | Asia : North East Asia | 92.09% | 0.05% | 8,872 |
| 12 | Jiangxi Air | Asia : North East Asia | 92.04% | 0.57% | 2,283 |
| 13 | HK Express | Asia : North East Asia | 91.94% | 0.00% | 3,511 |
| 14 | China Southern Airlines | Asia : North East Asia | 91.61% | 0.13% | 67,141 |
| 15 | FlySafair | Africa : Southern Africa | 91.47% | 0.36% | 5,262 |
| 16 | Sky Airline | Latin America : Lower South America | 91.20% | 0.87% | 4,366 |
| 17 | Beijing Capital Airlines | Asia : North East Asia | 91.07% | 0.09% | 7,417 |
| 18 | Fuji Dream Airlines | Asia : North East Asia | 90.91% | 0.47% | 2,578 |
| 19 | Gulf Air | Middle East | 90.89% | 0.34% | 4,084 |
| 20 | Copa Airlines | Latin America : Central America | 90.72% | 0.11% | 12,490 |
| 21 | Kunming Airlines | Asia : North East Asia | 90.19% | 0.13% | 3,755 |
| 22 | Volaris | Latin America : Central America | 90.00% | 0.09% | 14,325 |
| 23 | Urumqi Airlines | Asia : North East Asia | 89.98% | 0.17% | 2,411 |
| 24 | Lucky Air | Asia : North East Asia | 89.75% | 0.37% | 5,475 |
| 25 | Akasa Air | Asia : South Asia | 89.71% | 3.38% | 4,557 |
| 26 | Aeromexico | Latin America : Central America | 89.36% | 0.49% | 13,586 |
| 27 | Thai Airasia | Asia : South East Asia | 89.34% | 0.04% | 6,990 |
| 28 | Indonesia Airasia | Asia : South East Asia | 89.29% | 3.57% | 2,520 |
| 29 | Middle East Airlines | Middle East | 88.68% | 0.00% | 2,036 |
| 30 | Japan Transocean Air | Asia : North East Asia | 88.68% | 0.21% | 1,873 |
| 31 | Juneyao Airlines | Asia : North East Asia | 87.67% | 0.09% | 10,615 |
| 32 | Fuzhou Airlines Co., Ltd | Asia : North East Asia | 87.60% | 0.00% | 1,990 |
| 33 | Oman Air | Middle East | 87.60% | 0.80% | 2,863 |
| 34 | Hong Kong Airlines | Asia : North East Asia | 87.34% | 0.14% | 2,215 |
| 35 | Solaseed | Asia : North East Asia | 87.32% | 0.42% | 2,400 |
| 36 | Avianca | Latin America : Upper South America | 87.27% | 1.10% | 21,649 |
| 37 | Air New Zealand | Southwest Pacific | 87.14% | 1.57% | 13,228 |
| 38 | Tianjin Airlines | Asia : North East Asia | 87.12% | 1.69% | 9,974 |
| 39 | Austrian Airlines Ag Dba Austrian | Europe : Western Europe | 86.81% | 0.56% | 11,821 |
| 40 | Korean Air | Asia : North East Asia | 86.80% | 0.22% | 10,998 |
| 41 | Caribbean Airlines | Latin America : Caribbean | 86.74% | 0.17% | 2,289 |
| 42 | Xizang Airlines | Asia : North East Asia | 86.65% | 0.83% | 6,497 |
| 43 | Ruili Airlines | Asia : North East Asia | 86.63% | 0.21% | 3,778 |
| 44 | IndiGo | Asia : South Asia | 86.59% | 0.37% | 58,305 |
| 45 | Qantas Airways | Southwest Pacific | 86.57% | 0.85% | 23,460 |
| 46 | West Air | Asia : North East Asia | 86.49% | 0.07% | 5,859 |
| 47 | Jeju Airlines | Asia : North East Asia | 86.26% | 0.10% | 6,777 |
| 48 | Iberia | Europe : Western Europe | 86.25% | 0.69% | 19,528 |
| 49 | Philippine Airlines | Asia : South East Asia | 86.13% | 1.45% | 7,535 |
| 50 | Shenzhen Airlines | Asia : North East Asia | 86.11% | 0.61% | 21,559 |
| 51 | Star Flyer | Asia : North East Asia | 85.70% | 1.17% | 1,877 |
| 52 | Peach Aviation Limited | Asia : North East Asia | 85.54% | 0.04% | 5,556 |
| 53 | Xiamen Airlines | Asia : North East Asia | 85.44% | 0.83% | 18,605 |
| 54 | Malaysia Airlines | Asia : South East Asia | 85.40% | 0.39% | 8,433 |
| 55 | Jambojet | Africa : Eastern Africa | 85.38% | 0.51% | 1,758 |
| 56 | Cathay Pacific Airways | Asia : North East Asia | 85.22% | 0.48% | 10,412 |
| 57 | South African Airways | Africa : Southern Africa | 85.17% | 0.38% | 2,132 |
| 58 | Spring Airlines | Asia : North East Asia | 85.13% | 0.25% | 17,750 |
| 59 | Norwegian Air Shuttle | Europe : Western Europe | 85.12% | 0.67% | 8,002 |
| 60 | SAS Scandinavian Airlines | Europe : Western Europe | 85.12% | 1.09% | 24,172 |
| 61 | WestJet | North America | 85.08% | 0.81% | 17,390 |
| 62 | Breeze Airways | North America | 84.81% | 0.00% | 6,823 |
| 63 | SunExpress | Europe : Eastern/Central Europe | 84.79% | 0.10% | 11,521 |
| 64 | China Eastern Airlines | Asia : North East Asia | 84.31% | 2.22% | 70,486 |
| 65 | Lot - Polish Airlines | Europe : Eastern/Central Europe | 84.09% | 0.21% | 10,462 |
| 66 | Wizz Air | Europe : Eastern/Central Europe | 83.81% | 0.07% | 17,383 |
| 67 | Garuda Indonesia | Asia : South East Asia | 83.64% | 5.88% | 6,935 |
| 68 | China Express Airlines | Asia : North East Asia | 83.63% | 0.58% | 12,900 |
| 69 | Vivaaerobus | Latin America : Central America | 83.22% | 1.07% | 12,528 |
| 70 | Norwegian | Europe : Western Europe | 83.19% | 0.51% | 7,900 |
| 71 | Starlux Airlines | Asia : North East Asia | 83.13% | 0.04% | 2,648 |
| 72 | Aer Lingus | Europe : Western Europe | 82.88% | 0.99% | 10,945 |
| 73 | Finnair | Europe : Western Europe | 82.78% | 0.86% | 10,532 |
| 74 | Icelandair | Europe : Western Europe | 82.58% | 3.16% | 3,645 |
| 75 | Airasia | Asia : South East Asia | 82.34% | 1.01% | 13,977 |
| 76 | Air Baltic Corporation | Europe : Eastern/Central Europe | 82.32% | 0.00% | 4,320 |
| 77 | Air France | Europe : Western Europe | 81.81% | 1.06% | 23,039 |
| 78 | LATAM Airlines Group | Latin America : Lower South America | 81.53% | 0.87% | 51,207 |
| 79 | Delta Air Lines | North America | 81.46% | 0.92% | 149,522 |
| 80 | Citilink | Asia : South East Asia | 81.46% | 5.87% | 7,672 |
| 81 | Donghai Airlines | Asia : North East Asia | 80.95% | 0.11% | 3,568 |
| 82 | Qatar Airways | Middle East | 80.50% | 0.27% | 15,224 |
| 83 | Air India | Asia : South Asia | 80.18% | 0.41% | 17,778 |
| 84 | Deutsche Lufthansa Ag | Europe : Western Europe | 80.12% | 0.47% | 31,715 |
| 85 | Alaska Airlines | North America | 79.76% | 1.60% | 45,948 |
| 86 | Brussels Airlines | Europe : Western Europe | 79.68% | 1.53% | 6,913 |
| 87 | Azul Airlines | Latin America : Lower South America | 79.07% | 3.94% | 24,171 |
| 88 | Allegiant Air | North America | 78.93% | 0.07% | 7,034 |
| 89 | Virgin Atlantic Airways | Europe : Western Europe | 78.86% | 1.91% | 2,099 |
| 90 | Flair Airlines | North America | 78.46% | 0.26% | 2,317 |
| 91 | Air India Express | Asia : South Asia | 78.42% | 0.02% | 13,688 |
| 92 | EVA Airways | Asia : North East Asia | 78.24% | 0.11% | 5,221 |
| 93 | Jetsmart | Latin America : Lower South America | 77.84% | 0.00% | 8,477 |
| 94 | Japan Airlines | Asia : North East Asia | 77.68% | 1.46% | 25,600 |
| 95 | United Airlines | North America | 77.63% | 1.00% | 149,944 |
| 96 | All Nippon Airways | Asia : North East Asia | 77.50% | 1.74% | 25,240 |
| 97 | Wizz Air UK | Europe : Western Europe | 77.48% | 0.94% | 2,439 |
| 98 | Skymark Airlines | Asia : North East Asia | 77.36% | 1.03% | 4,939 |
| 99 | Wizz Air Malta | Europe : Western Europe | 77.28% | 0.70% | 16,614 |
| 100 | Edelweiss Air | Europe : Western Europe | 77.26% | 0.48% | 2,285 |
| 101 | Air Dolomiti S.P.A L.A.R.E | Europe : Western Europe | 77.15% | 0.74% | 2,964 |
| 102 | Binter Canarias | Europe : Western Europe | 77.12% | 1.27% | 9,056 |
| 103 | Cebu Pacific Air | Asia : South East Asia | 76.94% | 0.02% | 9,047 |
| 104 | Etihad Airways | Middle East | 76.83% | 0.19% | 9,496 |
| 105 | SATA Air Açores | Europe : Western Europe | 76.73% | 1.09% | 2,195 |
| 106 | Fiji Airways | Southwest Pacific | 76.60% | 1.24% | 2,504 |
| 107 | Air Europa | Europe : Western Europe | 76.48% | 0.13% | 6,389 |
| 108 | Jetstar Japan | Asia : North East Asia | 76.47% | 2.67% | 2,956 |
| 109 | Vietnam Airlines | Asia : South East Asia | 76.43% | 1.05% | 12,533 |
| 110 | Suparna Airlines Co | Asia : North East Asia | 76.40% | 0.29% | 1,739 |
| 111 | China Airlines | Asia : North East Asia | 76.06% | 0.06% | 4,874 |
| 112 | American Airlines | North America | 75.97% | 1.07% | 185,470 |
| 113 | Saudi Arabian Airlines | Middle East | 75.50% | 3.85% | 15,131 |
| 114 | Virgin Australia International | Southwest Pacific | 75.26% | 1.43% | 14,087 |
| 115 | Frontier Airlines | North America | 75.18% | 0.65% | 18,283 |
| 116 | Emirates | Middle East | 75.00% | 0.15% | 14,542 |
| 117 | Tarom | Europe : Eastern/Central Europe | 74.91% | 0.00% | 1,671 |
| 118 | Jetstar Airways | Southwest Pacific | 74.85% | 0.74% | 11,718 |
| 119 | JetBlue Airways | North America | 74.76% | 1.82% | 24,229 |
| 120 | Swiss | Europe : Western Europe | 74.53% | 0.89% | 12,891 |
| 121 | British Airways | Europe : Western Europe | 74.34% | 3.28% | 26,499 |
| 122 | Lufthansa City Airlines | Europe : Western Europe | 74.03% | 0.75% | 3,198 |
| 123 | Southwest Airlines | North America | 74.01% | 0.35% | 112,186 |
| 124 | KLM Royal Dutch Airlines | Europe : Western Europe | 72.91% | 2.65% | 22,521 |
| 125 | Ryanair | Europe : Western Europe | 72.88% | 0.94% | 108,329 |
| 126 | flydubai | Middle East | 72.56% | 0.90% | 8,715 |
| 127 | Discover Airlines | Europe : Western Europe | 72.21% | 0.22% | 2,774 |
| 128 | Utair Aviation | Europe : Eastern/Central Europe | 71.88% | 2.39% | 4,733 |
| 129 | AIR DO | Asia : North East Asia | 71.45% | 1.31% | 1,990 |
| 130 | Philippines Airasia Inc. | Asia : South East Asia | 71.41% | 0.94% | 2,014 |
| 131 | Air Canada | North America | 71.24% | 3.46% | 33,625 |
| 132 | Transavia.Com | Europe : Western Europe | 70.48% | 0.03% | 6,112 |
| 133 | Eurowings | Europe : Western Europe | 70.47% | 0.66% | 17,985 |
| 134 | flynas | Middle East | 69.86% | 0.14% | 8,477 |
| 135 | Condor Flugdienst | Europe : Western Europe | 69.72% | 0.05% | 7,355 |
| 136 | easyJet | Europe : Western Europe | 69.62% | 1.87% | 56,501 |
| 137 | Cape Air | North America | 68.10% | 10.53% | 8,154 |
| 138 | Porter Airlines | North America | 67.06% | 3.17% | 8,033 |
| 139 | TAP Air Portugal | Europe : Western Europe | 66.86% | 0.10% | 10,305 |
| 140 | Air Transat A.T.Inc. | North America | 66.75% | 0.09% | 2,138 |
| 141 | Jet2.Com | Europe : Western Europe | 66.06% | 0.01% | 15,292 |
| 142 | Aegean Airlines | Europe : Western Europe | 64.92% | 0.10% | 11,215 |
| 143 | Nouvelair | Africa : North Africa | 64.91% | 0.00% | 2,232 |
| 144 | Air Arabia | Middle East | 64.79% | 0.42% | 6,866 |
| 145 | Air Inuit | North America | 64.26% | 4.25% | 1,601 |
| 146 | Aerolineas Argentinas | Latin America : Lower South America | 63.89% | 0.35% | 9,222 |
| 147 | El Al Israel Airlines | Middle East | 63.46% | 0.24% | 3,683 |
| 148 | Sky Express S.A. | Europe : Western Europe | 63.35% | 0.00% | 6,375 |
| 149 | Ethiopian Airlines | Africa : Eastern Africa | 62.23% | 0.04% | 14,823 |
| 150 | ITA Airways | Europe : Western Europe | 61.64% | 1.27% | 10,756 |
| 151 | Kenya Airways | Africa : Eastern Africa | 56.71% | 1.26% | 2,700 |
All airlines = minimum 1,500 flights in Sep 2026 · Source: OAG Flight Status Data
No airlines match your search.
| # | Airline | Region | OTP | Cancellations | Flights |
|---|---|---|---|---|---|
| 1 | Air Busan | Asia : North East Asia | 92.81% | 0.03% | 3,521 |
| 2 | Jiangxi Air | Asia : North East Asia | 92.04% | 0.57% | 2,283 |
| 3 | HK Express | Asia : North East Asia | 91.94% | 0.00% | 3,511 |
| 4 | Sky Airline | Latin America : Lower South America | 91.20% | 0.87% | 4,366 |
| 5 | Beijing Capital Airlines | Asia : North East Asia | 91.07% | 0.09% | 7,417 |
| 6 | Volaris | Latin America : Central America | 90.00% | 0.09% | 14,325 |
| 7 | Urumqi Airlines | Asia : North East Asia | 89.98% | 0.17% | 2,411 |
| 8 | Lucky Air | Asia : North East Asia | 89.75% | 0.37% | 5,475 |
| 9 | Akasa Air | Asia : South Asia | 89.71% | 3.38% | 4,557 |
| 10 | Thai Airasia | Asia : South East Asia | 89.34% | 0.04% | 6,990 |
| 11 | Indonesia Airasia | Asia : South East Asia | 89.29% | 3.57% | 2,520 |
| 12 | Solaseed | Asia : North East Asia | 87.32% | 0.42% | 2,400 |
| 13 | IndiGo | Asia : South Asia | 86.59% | 0.37% | 58,305 |
| 14 | West Air | Asia : North East Asia | 86.49% | 0.07% | 5,859 |
| 15 | Jeju Airlines | Asia : North East Asia | 86.26% | 0.10% | 6,777 |
| 16 | Peach Aviation Limited | Asia : North East Asia | 85.54% | 0.04% | 5,556 |
| 17 | Jambojet | Africa : Eastern Africa | 85.38% | 0.51% | 1,758 |
| 18 | Spring Airlines | Asia : North East Asia | 85.13% | 0.25% | 17,750 |
| 19 | Norwegian Air Shuttle | Europe : Western Europe | 85.12% | 0.67% | 8,002 |
| 20 | Breeze Airways | North America | 84.81% | 0.00% | 6,823 |
| 21 | SunExpress | Europe : Eastern/Central Europe | 84.79% | 0.10% | 11,521 |
| 22 | Wizz Air | Europe : Eastern/Central Europe | 83.81% | 0.07% | 17,383 |
| 23 | Vivaaerobus | Latin America : Central America | 83.22% | 1.07% | 12,528 |
| 24 | Norwegian | Europe : Western Europe | 83.19% | 0.51% | 7,900 |
| 25 | Airasia | Asia : South East Asia | 82.34% | 1.01% | 13,977 |
| 26 | Citilink | Asia : South East Asia | 81.46% | 5.87% | 7,672 |
| 27 | Azul Airlines | Latin America : Lower South America | 79.07% | 3.94% | 24,171 |
| 28 | Allegiant Air | North America | 78.93% | 0.07% | 7,034 |
| 29 | Flair Airlines | North America | 78.46% | 0.26% | 2,317 |
| 30 | Air India Express | Asia : South Asia | 78.42% | 0.02% | 13,688 |
| 31 | Jetsmart | Latin America : Lower South America | 77.84% | 0.00% | 8,477 |
| 32 | Wizz Air UK | Europe : Western Europe | 77.48% | 0.94% | 2,439 |
| 33 | Skymark Airlines | Asia : North East Asia | 77.36% | 1.03% | 4,939 |
| 34 | Wizz Air Malta | Europe : Western Europe | 77.28% | 0.70% | 16,614 |
| 35 | Cebu Pacific Air | Asia : South East Asia | 76.94% | 0.02% | 9,047 |
| 36 | Jetstar Japan | Asia : North East Asia | 76.47% | 2.67% | 2,956 |
| 37 | Virgin Australia International | Southwest Pacific | 75.26% | 1.43% | 14,087 |
| 38 | Frontier Airlines | North America | 75.18% | 0.65% | 18,283 |
| 39 | Jetstar Airways | Southwest Pacific | 74.85% | 0.74% | 11,718 |
| 40 | JetBlue Airways | North America | 74.76% | 1.82% | 24,229 |
| 41 | Southwest Airlines | North America | 74.01% | 0.35% | 112,186 |
| 42 | Ryanair | Europe : Western Europe | 72.88% | 0.94% | 108,329 |
| 43 | flydubai | Middle East | 72.56% | 0.90% | 8,715 |
| 44 | Philippines Airasia Inc. | Asia : South East Asia | 71.41% | 0.94% | 2,014 |
| 45 | Transavia.Com | Europe : Western Europe | 70.48% | 0.03% | 6,112 |
| 46 | Eurowings | Europe : Western Europe | 70.47% | 0.66% | 17,985 |
| 47 | flynas | Middle East | 69.86% | 0.14% | 8,477 |
| 48 | easyJet | Europe : Western Europe | 69.62% | 1.87% | 56,501 |
| 49 | Jet2.Com | Europe : Western Europe | 66.06% | 0.01% | 15,292 |
| 50 | Air Arabia | Middle East | 64.79% | 0.42% | 6,866 |
Low-cost airlines = minimum 1,500 flights in Sep 2026 · Source: OAG Flight Status Data
Never miss an update
Each month, we send an email alert to let you know when the on-time performance data has been updated.
Would you like to be added to the list? Just add your email.
What is OTP
On-time performance (OTP) data is critical to understanding the performance of airlines and airports.
Across the aviation industry, an airline departure or arrival occurring within 15 minutes of the scheduled time is considered on-time.
OTP is a crucial key performance indicator for airlines and airports, it helps to gauge their efficiency and also has the potential to set them apart from their competitors.
Understanding the data
On-time performance data shows the percentage of flights that have departed (for airports) or arrived (for airlines) on-time.
A flight is considered on-time if it has departed or arrived within 15 minutes of the schedule.
The higher the percentage, the better the OTP score.
Cancellations are included in our data and are considered not on-time.
For an airline or airport's OTP to be published, OAG requires access to flight status data for at least 80% of all scheduled flights operated, and to be ranked they must operate a minimum of 1,500 flights that month.
Not included? Contact us and we will be happy to discuss our requirements.
What is OTP in the aviation industry?
-
How is airline OTP calculated?
Airline on-time performance is based on actual gate arrival times. Flights that arrive within 15 minutes of the schedule are considered on-time. Arriving 15 minutes or more after the scheduled time is considered not on time.
-
Why is OTP important for airlines and airports?
OTP has a critical role to play in airline operations management. Delays affect productivity and cost airlines millions of dollars every year. Flight punctuality is also of the highest importance to the traveler, poor punctuality will mean that flights arrive at their gate late or depart late – which could lead to passengers missing connecting flights. Many airlines have embedded OTP as a KPI using this to measure and evaluate processes and identify improvements to their operations.
Airlines and airports can analyze operational processes with different stakeholders e.g. ground handling and catering companies, and use OTP within their systems to support better collaboration and efficiency. They can understand how operations at different locations perform to understand and learn from best practice.
Many airlines choose to use OTP as one of their performance measures for staff, encouraging teams to work together towards the efficient turnaround of aircraft.
-
How can flight on-time performance data be used?
OTP is a valuable metric for airlines and is an outward demonstration of reliability which can affect brand loyalty and ticket sales. Customer satisfaction is influenced by customer expectations and a flight that arrives after the scheduled arrival time can be a stressful experience for passengers. Managing expectations is necessary and On-Time Performance flight and airline statistics provides an external verification about flight reliability, so passengers can be better informed regarding the probability of their flight arriving on-time.
-
What is the impact of poor on-time performance?
Poor punctuality means flights arrive at their gate late or depart late, with consequences for other flights planning to use those gates. This results in extended time on taxiways, leading to unnecessary fuel consumption. Additionally, passengers may miss their connecting flights.
Flight punctuality also impacts airline crews; if a flight is delayed, the crew might be unable to operate their subsequent flight, potentially causing further cancellations or delays.
In Europe, where passengers are entitled to compensation for late flights, there is also direct cost associated with poor OTP.
-
What is the impact of good on-time performance?
It takes hard work and attention to detail for an airline to operate truly reliable schedules. Achieving a high level of on-time performance is a complex task with a myriad of variables, not all of which lie within the control of an airline. Conversely, poor OTP is often a sign of inefficiencies and weak management control of operations.
For those airlines which succeed the rewards are tangible:- More flights operating according to the schedule reflects an efficient airline.
- Inefficiencies - appearing as late flights and missed connections - cost airlines money for fuel, additional ground handling, staff payments and passenger compensation.
- Passengers, and especially regular fliers, reward reliability with brand loyalty and repeat business.
- Fewer delays and missed connections enhance customer satisfaction.
- Close partnerships with airports on OTP is a pre-requisite for the smooth operation of a hub airport.
-
What is a good on-time performance target?
Measuring On-Time Performance can be challenging. With millions and millions of flight records, and real-time updates of hundreds of flights at airports around the globe every day, Any measure that can be applied across companies working in the same sector is valuable as a benchmark for performance.
Probably most people in the industry would accept that an OTP of 80% or above is pretty good. That’s 4 in 5 flights arriving within 15 minutes of their scheduled arrival time. The very best airlines and airports succeed in punctuality closer to 90% - but they remain the exception rather than the rule.
Going much beyond 80% of flights on-time will be easier for some than for others. Operating at congested airports and in congested airspace will make it harder. And as climate change begins to create more chaotic weather conditions, and storms in particular, keeping to schedule will be harder.
Achieving OTP well above 80% requires focus but there may be a point where striving towards ever higher OTP may be detrimental to the bottom line. The benefit of incremental improvements may be outweighed by the cost of achieving them.
-
What is schedule padding?
One of the major talking points of airline On-Time Performance statistics is the practice of ‘padding schedules’, where the time between the scheduled departure and the scheduled arrival have increased as a means of achieving higher OTP.
In practice, determining the correct schedule times for a flight are not straightforward. Build in too much padding so that flights are always on-time and you might lose one aircraft rotation each day, which has a major impact on the revenue generated by the asset. Build in too little padding and flights may regularly be late, causing a knock-on effect on every subsequent rotation of that aircraft for the rest of the day.
-
Is schedule padding a bad thing?
While schedule padding could be construed as airlines scheduling to make performance look better, there is also a case where congestion actually allows a passenger’s expectations to be met. So schedule padding is not a bad thing, the question we should be asking is are airlines successfully managing their customers’ expectations?
-
Is 15 minutes the right on-time measurement?
The idea of having fifteen minutes as a measurement is a hot talking point in the world of OTP. For many in the industry, it is a case of not having enough leeway needed in order to provide a streamlined service, whereas some countries, such as China which uses 30 minutes as its definition of late, have chosen to adopt a different rule.
We explore this question about the right definition of late in more depth here.
-
How can airlines and airports improve OTP?
Increasingly airlines and airports are focusing on the detail of achieving strong OTP. Some of the key areas to improve OTP include:
- Collaborative decision making (CDM).
- Good quality metrics and timely dashboards which ensure problems are addressed early.
- Build OTP into performance targets, either with contractors through service agreements, or for staff through bonuses.
- Use of predictive tools is also becoming more commonplace so that data collected as passengers pass through an airport can be used for planning staffing levels or identifying passengers who are late.
Whatever approach an airline or airport takes to managing punctuality, there are no quick fixes. Achieving high levels of punctuality is a complex task and those with high OTP deserve to be congratulated.
-
How is OTP tracked?
OTP is tracked through multiple sources including directly from airlines, airports, control authorities and others involved in the wider travel eco-system.
-
How often is the data refreshed?
The OTP data is updated each month, usually during the second week. You can sign up to receive notifications by clicking on the link below.
-
Why is my airline not included?
To be included in OAG's rankings airlines must reach a minimum size criteria of 1500 flights operated in the current month and a coverage qualification. If you want to discuss our requirements in more detail, click the link below.
Usage and attribution
For Media:
- Attribution: Proper credit must be given to OAG, and their website, www.oag.com, should be included.
- Proper Citation: To be used with all OAG provided data or analysis, as noted here:
- OAG, global air travel data provider
- Citations for data, analyses or insights: “… according to OAG data/analysis/insights”
- Specific data used in charts: “Source: OAG data filed (include date)”
For Non-Media
- Permission Requirement: The data should not be copied in part or its entirety or in its original format without explicit permission from OAG.
More from OAG
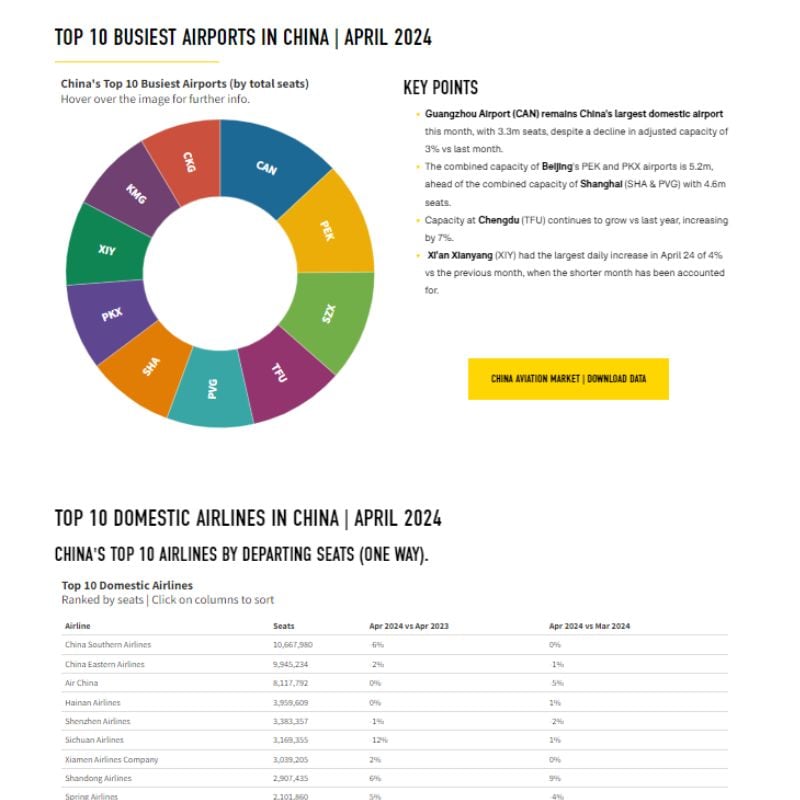
China Aviation market Data
The busiest airports, largest airlines, biggest cities for airline capacity and more
View Data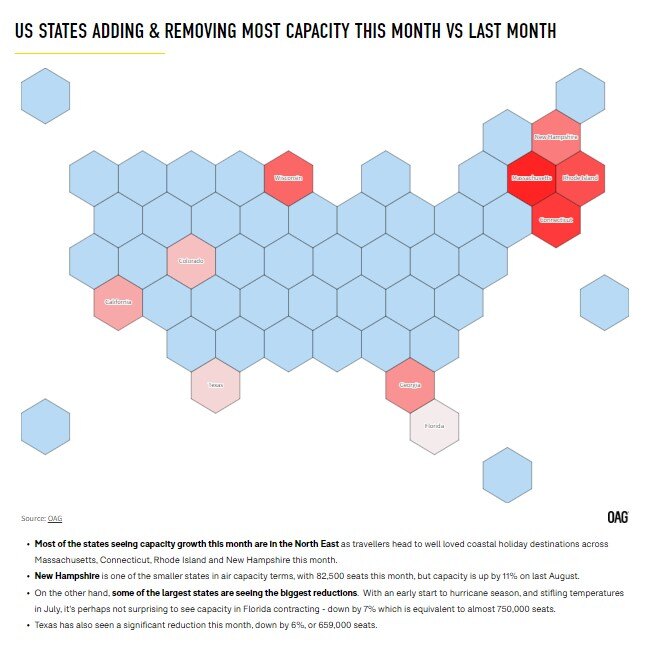
US Aviation Market Data
This month's leading airlines, airports, states and more from the US market.
View Data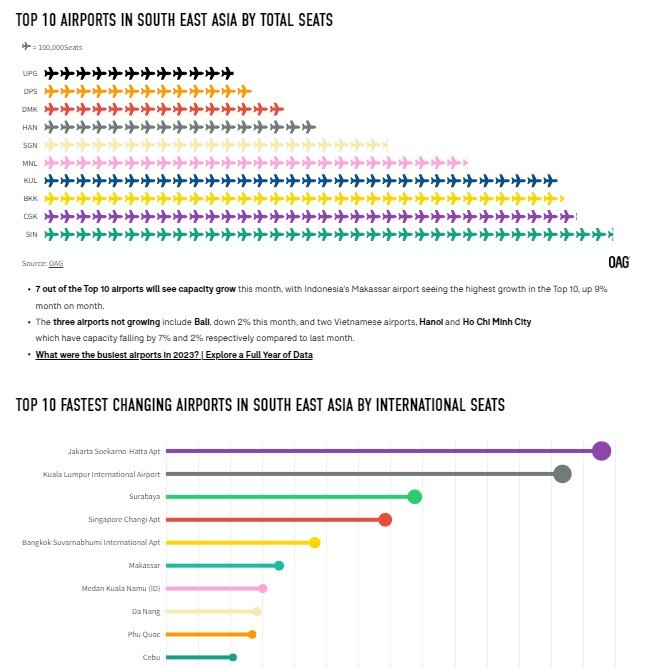
South East Asian Aviation Market Data
SE Asia's biggest country markets, airports, airlines and more are updated each month.
View Data


Aviation Market Analysis
Analysis of the latest data and developments in the aviation world.
Read Now