.png?width=1600&height=900&name=FIVE%20YEARS%20ON%20FROM%20LOCKDOWNS%20(1600%20x%20900%20px).png)

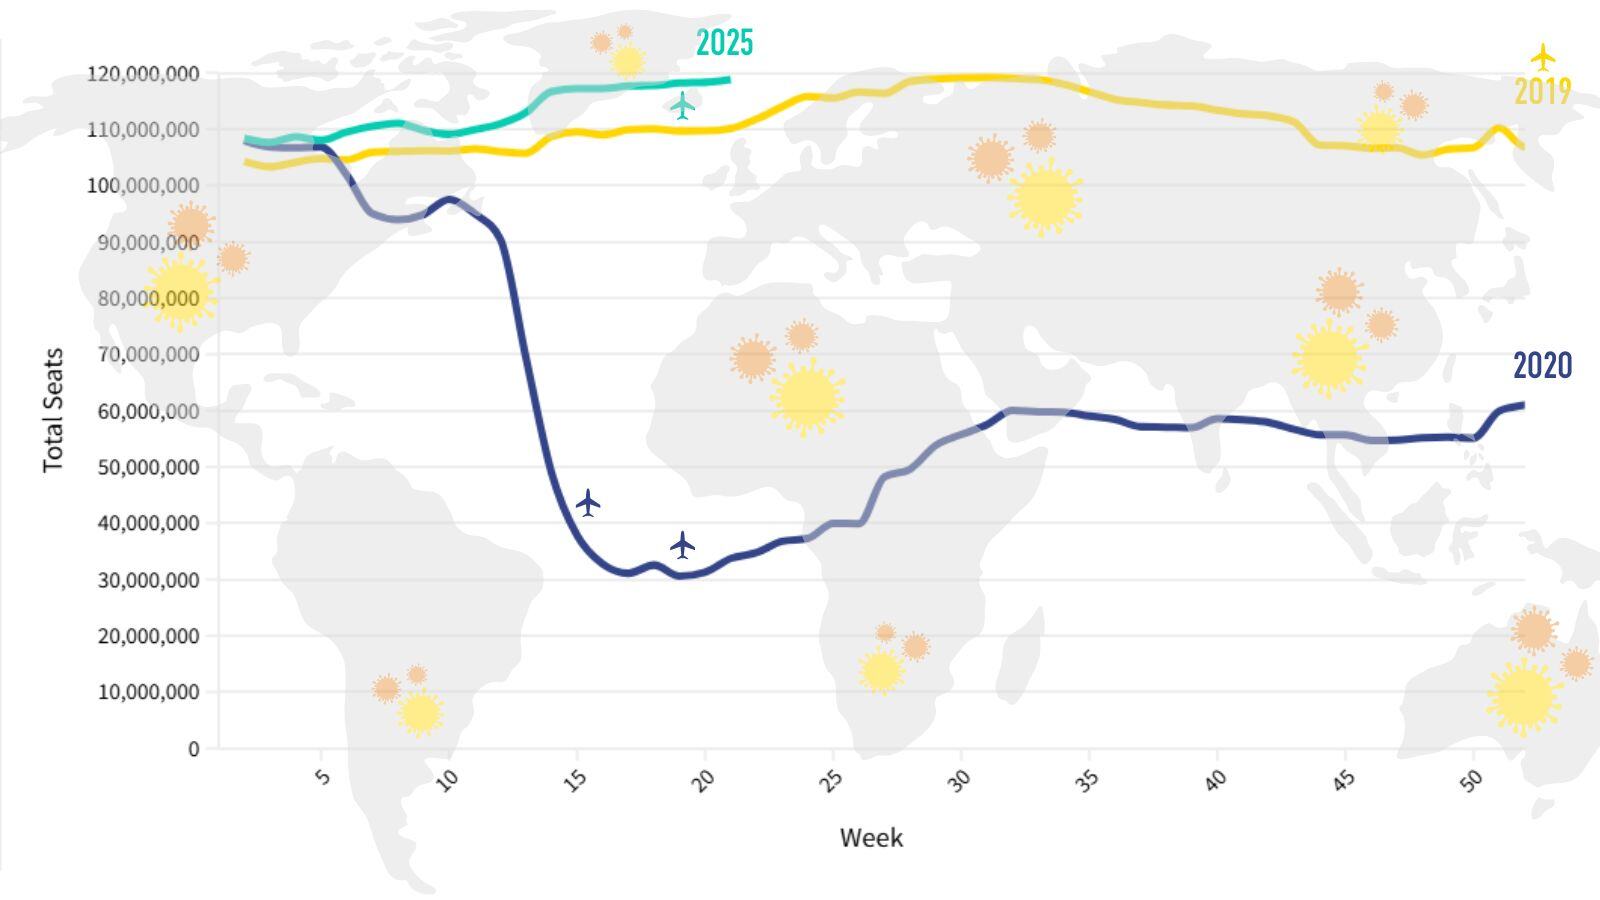
This time five years ago, global airline capacity was heading quickly towards its lowest point of the Covid-19 pandemic. This chart shows the dramatic drop in seats available (domestic and international combined) worldwide as travel restrictions came into force.
How Did Covid-19 Lockdowns Affect Air Travel?
By early April 2020, 1/3 people worldwide were under some form of movement restriction or lockdown, and the effect of these shutdowns is clearly visible on this graph, showing weekly airline capacity in 2019 (pre-pandemic), 2020 and 2025. Capacity reached its lowest point of the pandemic in week 19 of 2020 (week commencing 4th May), falling to 30.5m seats, a 72% reduction compared to the same week of 2019.
Total annual capacity in 2020 was 3.2 billion seats, compared to 5.8 billion in 2019.
Following a long road to recovery, capacity in week 19 of 2025 is expected to reach 118.2m seats, 8% above the same week in 2019.
As the trusted source for airline schedules data, throughout the pandemic OAG tracked airline capacity each week. You can view data for 2019-2023 here.